Recommended resources
The freely available resources this lesson will direct you to.
- Linux Performance Troubleshooting Demoswww.youtube.com
- How to troubleshoot High RAM and SWAP Memory Utilisation - top, uptime, free, ps, kill, pkill, /procwww.youtube.com
- Chapter 21. System Monitoring Tools | System Administrator’s Guide | Red Hat Enterprise Linux | 7 | Red Hat Documentationdocs.redhat.com
- How to Handle inode Exhaustion - When Disk Is Not Full But Writes Fail | Penguin Gym Linuxpenguin-gym-linux.com
Hello! Last lesson used service status, logs, and process inspection to explain why a particular service failed. A service can also fail—or become painfully slow—because the host runs short of a resource. The first task is to determine which resource is constrained; only then does it make sense to investigate a process, directory, or workload.
This lesson takes about 40 minutes. You’ll use read-only Linux commands to distinguish CPU pressure, memory pressure, disk-space exhaustion, and inode exhaustion, then narrow each finding to a plausible cause. The emphasis remains on collecting evidence before taking action on a production host.
Establish what is constrained
Start with the symptom and its time window. “Requests were slow for ten minutes” calls for different evidence from “the service cannot create a file right now.” Take more than one observation when investigating an intermittent slowdown: a single process snapshot may miss the activity that caused it.
Red Hat’s System Monitoring Tools explains the basic views we’ll use: ps captures a process snapshot, top refreshes process and host statistics, and free reports memory and swap.
Read Red Hat’s guide to learn which questions its process and memory commands answer.
In Chapter 21, read Section 21.1.1, “Using the ps Command,” beginning with the snapshot explanation and continuing through the ps aux column descriptions. In Section 21.1.2, “Using the top Command,” read the top overview, its output example, and the P, M, and q controls; stop before Section 21.1.3. Finally, in Section 21.2.1, “Using the free Command,” read the memory fields and the command examples; stop before Section 21.2.2. Focus on what each display measures, not on memorizing its sample numbers.
For a quick, read-only first look, run:
uptime
top
free -h
df -h
df -i
Exit top with q. This set asks four distinct questions: are tasks competing for CPU time; how much memory is available; which filesystem is short of data space; and which is short of inodes? None of these commands alone identifies the underlying workload. The next sections show how to narrow the search.
CPU: distinguish busy processors from waiting tasks
In top, examine the CPU summary before blaming the process at the top of its list. Sustained low id (idle) time, together with substantial us (user) or sy (kernel) time, supports CPU pressure. Press P to sort processes by CPU use; note the PID, owner, and command. A %CPU near 100 for one process generally indicates about one logical CPU’s worth of work, so a single busy thread can matter even when the host-wide CPU summary still shows idle capacity.
The load averages in uptime provide useful context, but load is not CPU percentage. Load includes runnable tasks and tasks in uninterruptible sleep, often waiting for I/O. A high load average therefore does not prove that processors are saturated. Compare it with CPU utilization and, when relevant, the logical CPU count:
nproc
Linux Performance Troubleshooting Demos by grobelDev demonstrates why this distinction matters. Watch its initial top and vmstat investigation, then the beginning of a second case in which a process accounts for heavy CPU use.
Linux Performance Troubleshooting Demos
Watch the two selected portions of “Linux Performance Troubleshooting Demos” to see a host-level observation checked against process-level evidence.
Watch the initial triage for the top CPU summary and vmstat fields, particularly runnable tasks and I/O wait. Then watch the CPU case through the identification of the busy program. Focus on the change from “the host is busy” to “this process is consuming CPU”; you do not need the later profiling tools for this lesson.
One useful cross-check is:
vmstat 1 6
This prints a line each second. The first data line reflects averages since boot; use the subsequent lines to judge the current pattern. Repeatedly high r (runnable tasks) relative to the available CPUs, alongside little idle CPU time, strengthens a CPU-contention hypothesis. Elevated wa means CPUs spent time waiting for I/O; it is a reason to investigate storage activity, not proof that the disk is full.
Once a process stands out, capture a more identifiable snapshot:
ps -eo pid,ppid,user,%cpu,%mem,rss,stat,comm --sort=-%cpu | head -n 12
ps -p 4217 -o pid,ppid,user,stat,args
Replace 4217 with the observed PID. The parent PID and command can reveal whether an application, scheduled task, or supervising service started it. ps is a snapshot, and its %CPU is not identical to top’s recent-interval reading; repeat observations if the process comes and goes. Also review command-line output before sharing it, since arguments sometimes contain sensitive values.
Memory: look at availability and current pressure
Linux uses otherwise idle RAM for caches. Consequently, a small free number in free -h is not, by itself, evidence of exhaustion. On its Mem: line, start with available: it estimates how much memory can be supplied to new work without swapping. Then inspect the Swap: line and, if the system is slow, sample current swap activity:
free -h
vmstat 1 6
ps -eo pid,ppid,user,rss,%mem,stat,comm --sort=-rss | head -n 12
In vmstat, repeated nonzero si or so indicates pages being swapped in or out during the sample period. Swap already in use does not, on its own, prove current memory exhaustion: pages may remain in swap after an earlier period of pressure. Equally, zero swapping does not rule out a memory limit imposed on one service or container. Treat the video’s simple swap rule as an initial clue, not a definitive test.
The process list helps identify large resident-memory users; rss is physical memory resident for each process, typically reported in KiB. Do not add every process’s RSS and expect it to equal host memory use—processes can share pages. To connect a large process to the incident, check its owner, parent, service, and whether its usage persists or grows.
Sometimes the process responsible has already been killed and will not appear in ps. If a service recently disappeared while memory was tight, look for kernel out-of-memory messages from the relevant boot and time window:
sudo journalctl -k -b --no-pager | grep -Ei 'out of memory|oom|killed process'
An OOM entry is stronger evidence of a past memory failure than today’s process list. Correlate its timestamp and named process with the incident; absence of such a line is not conclusive, especially if the event occurred in an earlier boot or under a separate workload memory limit.
Disk space: find the affected filesystem, then its contents
A write failure such as No space left on device is about the filesystem that holds the target path, not necessarily the root filesystem. Red Hat’s disk sections explain the complementary roles of df and du.
Return to Red Hat’s guide for the filesystem-level and directory-level views of disk consumption.
In Chapter 21, read Section 21.4.4, “Using the df Command,” from the reported columns through its df -h example. Then read Section 21.4.5, “Using the du Command,” beginning at the directory example and continuing through the du -sh example; stop before Section 21.4.6. Keep the distinction clear: df measures a filesystem, while du totals reachable files beneath a directory.
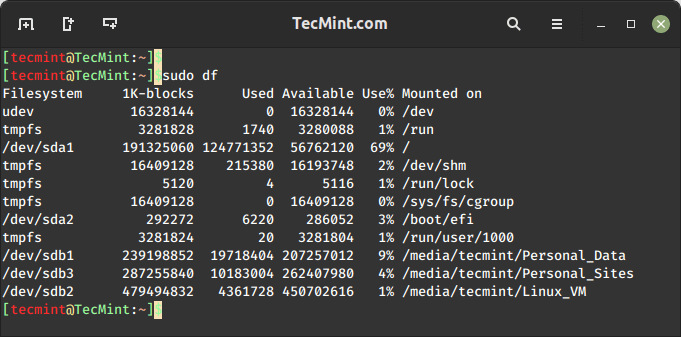
The image below is a df display. Its Mounted on column is as important as Use%: /dev/sda1 holds / and is 69% used, while other entries represent different mounts, including memory-backed tmpfs filesystems. Nothing in this screenshot demonstrates an exhausted filesystem.
If the application cannot write /var/log/sampleapp/output.log, check the filesystem containing its log directory directly:
findmnt -T /var/log/sampleapp
df -h /var/log/sampleapp
df -i /var/log/sampleapp
findmnt -T identifies the mount associated with the path. The two df commands test different limits; a healthy result for one does not establish a healthy result for the other.
If block space is scarce, measure likely directories on that filesystem before inspecting individual files:
sudo du -x -h --max-depth=1 /var
sudo du -x -h --max-depth=1 /var/log
Here -x avoids crossing onto other filesystems beneath the starting path. Use a starting path on the affected mount; if /var is not on it, inspect the appropriate mount instead. du can take time and produce I/O on a busy host, so begin with a limited scope. Likely findings include growing logs, application data, or accumulated temporary files—but the measured directory, its owner, and its growth over the incident window are the evidence, not the category alone.
If df reports a full filesystem while du cannot account for the usage, one possible explanation is a deleted file still held open by a process. With appropriate access, inspect rather than immediately restarting anything:
sudo lsof +L1
Such a file continues to occupy space until the process closes it. A restart may release it, but it can also interrupt service; establish which process owns it and coordinate any change.
Inodes: explain a write failure when bytes remain free
An inode holds filesystem metadata for a file or directory. On a filesystem with a limited supply of inodes, a workload creating many small files can use up that supply while plenty of data blocks remain. That gives a seemingly contradictory pair of observations: df -h shows free space, but creating another file fails with No space left on device.
Read the diagnostic portions of How to Handle inode Exhaustion—When Disk Is Not Full But Writes Fail from Penguin Gym Linux. Its cleanup examples go beyond today’s goal; concentrate on identifying the affected mount and finding where files accumulated.
How to Handle inode Exhaustion - When Disk Is Not Full But Writes Fail | Penguin Gym Linux
Read this guide for the difference between free bytes and free inodes, and for a method of locating a large collection of files.
Read “What Is inode Exhaustion and Why Does It Happen?” through “Classic symptoms,” paying attention to the small-file pattern. In “1. Check inode Usage with df -i,” read the sample output and its mount-point interpretation. Then go to “2. Find the Directory Consuming inodes,” starting with the narrowing strategy; read “2-1. Count files quickly under a path” and “2-2. Aggregate file counts by subdirectory,” stopping before “2-3. Count entries in a single directory.” The opening df example repeats in the provided sections; read it once. Do not perform any deletion described later in the article.
Suppose df -h /var shows ample available space, but df -i /var shows IFree near zero and IUse% near 100%. You have identified an inode shortage on /var’s filesystem, not a shortage of bytes. Next, compare plausible subtrees, staying on that filesystem:
sudo find /var/log -xdev -printf '.' | wc -c
sudo find /var/cache -xdev -printf '.' | wc -c
Each command counts entries visited, including directories and files; it does not measure their sizes. Narrow further only under the unusually large subtree. On a filesystem already holding enormous numbers of entries, a full find traversal can itself be expensive. Begin where logs or workload knowledge suggest, and avoid hiding permission errors that would make an incomplete count look complete.
Identifying millions of session, queue, or log-fragment files is a diagnosis, not permission to remove them indiscriminately. They may be active application state. Establish why they accumulated and which retention or cleanup mechanism should manage them before proposing a change.
Bring the evidence back to the service
The host-level finding becomes useful when it explains the service symptom. A concise incident note might say: “At the time writes began failing, the filesystem mounted at /var had free data space but no free inodes; counts showed an unusually large number of entries under the application’s session directory.” That is more actionable than “disk issue,” and it states what was observed without claiming an unverified repair.
The four diagnostic paths have a common shape:
| Suspected constraint | Confirm it at host or mount level | Narrow the cause |
|---|---|---|
| CPU | Repeated top or vmstat samples |
Busy PID, owner, parent, service |
| Memory | free -h, current vmstat activity, relevant OOM logs |
Resident-memory users or a previously killed process |
| Disk space | df -h for the failing path |
du on the affected filesystem; open deleted files if totals disagree |
| Inodes | df -i for the failing path |
Counts under likely directories on that filesystem |
The commands identify constraints and candidates; timestamps, process ownership, mount boundaries, and application logs help establish the cause. Resist clearing files or terminating processes merely because they rank highest: first determine what depends on them.
Key takeaways
CPU use, available memory, free disk blocks, and free inodes are different measurements. Check the one relevant to the symptom, use repeated samples for changing conditions, and move from a host or filesystem observation to the responsible process or directory. Preserve the distinction between evidence of a constraint and a proposed fix.
Next, you’ll move from host troubleshooting to the request path itself, tracing how DNS, TCP, TLS, and HTTP participate when a client reaches an application.