Recommended resources
The freely available resources this lesson will direct you to.
- How To Manage Linux Services with systemctl and journalctl | Sysadmin Basicswww.youtube.com
- Using the ps Command | Efficient Process Monitoring on Linux Systemswww.youtube.com
- Managing systemd Servicesdocumentation.suse.com
- journalctl: Query the systemd Journal | Administration Guide | SLES 12 SP5documentation.suse.com
Hello! Last lesson established an important troubleshooting habit: check access as the account that runs the application, not just as an administrator. Now we’ll use that habit to diagnose a service that will not start—or starts and then exits.
In about 40 minutes, you’ll learn to distinguish a service’s configured state from its runtime state, inspect any processes still running, and use system logs to move from “the service failed” to a specific, testable explanation. The emphasis is on gathering evidence before changing a production service.
Start with the service manager’s view
On most Linux servers, systemd manages services as units. A .service unit describes how to launch an application and tracks its execution. systemctl asks the manager about that unit; journalctl retrieves relevant messages from the system journal.
Read the short foundation and troubleshooting portions of SUSE’s Managing systemd Services. They establish what a unit is and why status, processes, and logs are complementary views.
Read SUSE’s explanation of systemd units and its concise troubleshooting guidance. Focus on what each diagnostic command can tell you.
In Section 1, “What is systemd?”, begin at the unit explanation and stop after the description of unit files. Then go to Section 6, “Troubleshooting systemd management”; read the troubleshooting guidance, from its opening sentence through the explanation following the journal command.
Suppose the unit is sampleapp.service. Your first read-only checks might be:
systemctl status sampleapp.service --no-pager -l
systemctl cat sampleapp.service
In status, distinguish three different facts:
- Loaded tells you whether systemd found a unit definition and where it came from.
- Enabled concerns automatic startup at boot. An enabled service can nevertheless be failed right now.
- Active describes current runtime state.
failed (Result: exit-code)means an attempted operation failed; it does not, by itself, explain why.
Look below those lines for ExecStart, a process ID, an exit status, and recent log messages. An exit such as status=1/FAILURE reports that a program returned a failure code. A message such as status=203/EXEC points instead toward a problem executing the configured command. Neither is a substitute for the accompanying error message.
The following video demonstrates the difference between the compact status view and the fuller journal. Watch only the indicated segments.
How To Manage Linux Services with systemctl and journalctl | Sysadmin Basics
Watch “How To Manage Linux Services with systemctl and journalctl | Sysadmin Basics” from Akamai Developers to see status and unit-specific logs used at a terminal.
Watch service status for the initial state check. Then watch journal context and unit filtering to see why the few messages in status may not be enough. Finish with time filtering; notice how a known failure window narrows the search.
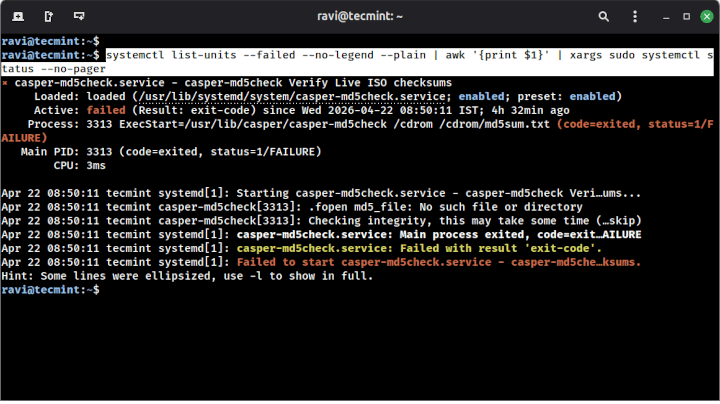
The screenshot below is a useful reminder to read past the word “failed.” Its service is loaded and enabled, yet its execution failed. The recent messages identify a missing file used by the checksum check—a much more specific lead than the service state alone. That lead still needs to be understood in the service’s operating context before anyone changes files.
Use logs to locate the failing attempt
systemctl status shows only a small selection of recent messages. For the full sequence associated with a unit, start with:
sudo journalctl -b -u sampleapp.service -n 100 --no-pager
Here -u selects the unit, -b restricts results to the current boot, and -n 100 limits the initial output. Use sudo only when your account is authorized and needs it to see the messages. If the failure occurred before a reboot, the current-boot filter will omit it; the previous boot can be requested with -b -1 if its journal is available.
For a known incident window, time bounds are often more useful than repeatedly asking for the latest lines:
sudo journalctl -u sampleapp.service \
  --since "2026-04-22 08:45:00" \
  --until "2026-04-22 09:00:00" \
  --no-pager
Read around the first relevant error, not just the final “Failed to start” message. Systemd may report the outcome after the application has already logged the cause. Also correlate timestamps: a warning from yesterday is not automatically the reason for a failure this morning.
SUSE’s journal guide provides the filtering details and a compact example in which status supplies a failed process ID, while the journal supplies the actual configuration error.
journalctl: Query the systemd Journal | Administration Guide | SLES 12 SP5
Read SUSE’s boot and time filters, then its worked service-failure investigation. The worked example shows the difference between an exit status and an actionable cause.
In Section 16.3, “Filtering the Journal Output,” read from the filtering introduction through subsections 16.3.1, “Filtering Based on a Boot Number,” and 16.3.2, “Filtering Based on Time Interval”; include the final command example immediately below that ending sentence. Then read Section 16.4, “Investigating systemd Errors,” from the investigation through the stated fix, and inspect the resulting status output immediately below it. Notice where the syntax-error message appears and how the new status confirms the service started.
A process ID from a failed attempt can help narrow historical messages:
sudo journalctl -b _PID=4217 --no-pager
Use the ID from your status output, not 4217 literally. This query selects messages attributed to that process; systemd’s own messages about the same attempt may have a different process ID. Keep the boot and time window in mind, because process IDs can be reused.
Not every application writes its useful errors to the journal. If unit logs contain only “started” and “exited,” inspect the unit configuration and the application’s documented log location. The previous lesson’s /var/log/sampleapp is one possible location, not a guarantee.
Inspect the process that exists—or establish that it is gone
Logs describe events; process inspection describes what is running now. If status reports a current main PID, inspect that exact process:
ps -p 4217 -o pid,ppid,user,stat,args
systemd-cgls -u sampleapp.service
ps shows the selected PID, parent PID, user, process state, and command line at one instant. systemd-cgls -u shows processes associated with the service’s control group, including children that a main-PID check might miss. Use the actual PID reported for your running service. If status instead reports that PID as exited, an empty ps result is expected; it does not contradict the historical failure record.
Watch the short process-inspection demonstration for the meaning of PID and for why choosing the output columns matters.
Using the ps Command | Efficient Process Monitoring on Linux Systems
Watch “Using the ps Command | Efficient Process Monitoring on Linux Systems” from Akamai Developers for the process fields needed during service diagnosis.
Watch process basics for PID and command fields. Skip ahead to selected columns to see how custom output makes a process snapshot easier to interpret. The ps -p command in this lesson applies that idea to a particular service PID.
Interpret a process snapshot cautiously. A missing process may mean it exited before you looked. Conversely, a present main process does not prove the application is serving requests correctly. For this lesson, the immediate question is narrower: Did the configured command execute, under which account, and what happened before or after it exited?
Put the evidence together before making a repair
Consider this illustrative status excerpt for the deployment pattern from the previous lesson:
Loaded: loaded (/etc/systemd/system/sampleapp.service; enabled)
Active: failed (Result: exit-code)
Process: 4217 ExecStart=/opt/sampleapp/releases/v1/start.sh
         (code=exited, status=1/FAILURE)
A journal entry from the same attempt reads:
sampleapp[4217]: cannot read /etc/sampleapp/settings.conf: Permission denied
The status establishes that systemd launched the configured command and that it exited unsuccessfully. The journal narrows the failure to a configuration-file read. Because PID 4217 has exited, looking for a live PID 4217 is less useful than checking the file access that caused the exit.
First verify the unit’s effective launch configuration and the path:
systemctl cat sampleapp.service
namei -l /etc/sampleapp/settings.conf
ls -l /etc/sampleapp/settings.conf
id sampleapp
sudo -u sampleapp -- test -r /etc/sampleapp/settings.conf
echo $?
systemctl cat shows the unit file and any systemd drop-ins, allowing you to check the configured command and service account. namei -l exposes each parent directory: a readable file is still inaccessible if the account cannot traverse its path. id helps check group membership. Run echo $? immediately after test; 0 means that this particular access test succeeded, while a nonzero result means it did not.
This test is evidence, not a perfect reproduction of every service setting: a unit can have additional isolation or access restrictions. If the access check fails, identify the specific incorrect owner, group, file mode, or parent-directory mode and restore the intended deployment permissions. Do not use chmod 777 to make the error disappear. If the check succeeds, revisit the unit configuration and the exact path and account named in the log rather than forcing a permissions change.
Only after identifying and applying an authorized fix should you start the service again and verify both its state and its new messages:
sudo systemctl start sampleapp.service
systemctl status sampleapp.service --no-pager -l
sudo journalctl -b -u sampleapp.service -n 30 --no-pager
On a production host, a restart or configuration change may affect users; coordinate it rather than treating it as a diagnostic command. Likewise, clearing a failed state without fixing its cause only removes evidence. When sharing output, review logs and unit definitions for secrets before copying them into a ticket or chat.
Key takeaways
Diagnose a failed service by combining systemd state, the relevant journal sequence, and a current process snapshot when a process still exists. Status tells you what systemd observed; logs can reveal why; process inspection confirms what is running and under which account. Tie those observations to the unit’s configured command and the paths it uses, then verify a targeted repair with a fresh start and fresh logs.
Next, you’ll broaden this approach from a single failed service to host-level resource problems: CPU, memory, disk-space, and inode exhaustion.