Hello! Welcome back to your second lesson.
In our last session, we established that "performance marketing" on YouTube is about setting clear goals and using data to achieve them, much like you'd monitor a software application's performance to ensure it meets its objectives. We analyzed how different channels use YouTube to achieve distinct goals, from mass awareness to direct lead generation.
Today, we're moving from the "what" to the "how." To measure performance, you need to know which numbers matter and where to find them. This lesson is your introduction to the YouTube Studio dashboard—your command center for channel analytics. Think of it as opening up the monitoring dashboard for your application for the first time. We'll identify the critical metrics that tell the story of your video's performance.
By the end of this lesson, you will be able to identify the core YouTube performance metrics—Click-Through Rate (CTR), Average View Duration (AVD), watch time, and conversions—and know exactly where to locate them in your analytics.
Your Command Center: A Tour of YouTube Studio Analytics
Before we can analyze any data, we need to know our way around the tool. YouTube Studio is where all your channel's performance data lives. The official YouTube Creators channel provides an excellent, concise tour.
Let's start with a guided tour of the Analytics section in YouTube Studio. This video will show you the main tabs and how to navigate the dashboard.
Watch the video from the beginning until 01:37. Pay attention to the four main tabs mentioned at the end: Overview, Reach, Engagement, and Audience. These are the sections we'll be exploring today.
As you saw, analytics are broken down into several key tabs. For a text-based reference that you can bookmark, the article "Mastering YouTube Analytics" by MediaCube offers very clear, step-by-step instructions for accessing analytics on both desktop and mobile.
Mastering YouTube Analytics: How to Read Your Stats Like a Pro
This article provides a great reference for navigating YouTube Studio. You don't need to read the whole thing now, but it's a useful resource to have.
Briefly review the section 'How to Open YouTube Analytics'. This reinforces what you saw in the video and provides instructions for both desktop and mobile access.
Now that you know the layout, let's define the core metrics you'll use to measure your channel's performance.
The Two Pillars of YouTube Performance
At its core, the YouTube algorithm tries to do two things:
- Find the right video for each viewer.
- Keep that viewer on the platform for as long as possible.
Your success on YouTube depends on how well your videos help the algorithm achieve these two goals. This translates to two primary metric categories: metrics that measure Discovery (getting clicked) and metrics that measure Engagement (keeping viewers watching).
1. Discovery Metrics: Impressions and Click-Through Rate (CTR)
You could create the most insightful video on AI or the most compelling political analysis, but if no one clicks on it, it has zero impact. This is where discovery metrics come in.
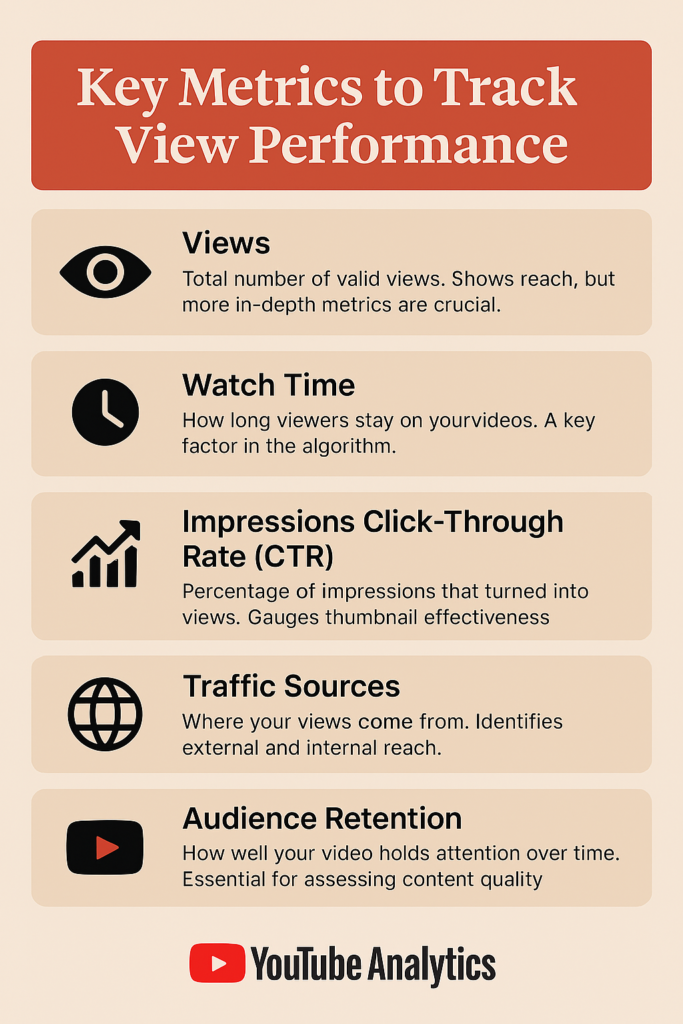
- Impressions: An impression is counted each time one of your video thumbnails is shown to a viewer on YouTube. This could be on the homepage, in search results, or as a suggested video. It represents an opportunity for a view.
- Impressions Click-Through Rate (CTR): This is the percentage of impressions that turned into a view. It's calculated as: . CTR is the single most important metric for measuring the effectiveness of your video's "packaging"—its title and thumbnail.

A high CTR tells YouTube that your video's packaging is compelling and relevant to the audience it's being shown to. A low CTR signals a mismatch.
The official YouTube Creators video explains where to find these metrics within the Reach tab.
Let's revisit the 'Analytics in YouTube Studio' video to see exactly where Impressions and CTR are located and how they are defined.
Watch the segment from 02:57 to 03:26. Focus on the definitions of Impressions, Click-through rate, and Unique viewers within the 'Reach' tab.
2. Engagement Metrics: Watch Time and Average View Duration (AVD)
Once a viewer clicks, your next goal is to hold their attention. This is where engagement metrics become critical.
- Watch Time: The total accumulated minutes viewers have spent watching your video. This is a foundational metric for the YouTube algorithm. More watch time signals a valuable video that keeps people on the platform.
- Average View Duration (AVD): The total watch time of your video divided by the total number of views. This tells you, on average, how long people are watching your video before clicking away.
A high AVD is a powerful signal to YouTube that your content is successfully satisfying the viewer's interest, which was initially sparked by your title and thumbnail.
Now, let's see where to find these metrics in the Engagement tab.
This next clip from the official YouTube guide explains the 'Engagement' tab, where you'll find data on viewer retention.
Watch from 03:50 to 04:09. Note the definitions of Watch Time and Average View Duration.
To understand why AVD is so crucial from a creator's perspective, the next video provides a more passionate, practical take.
YouTube Analytics Explained: Step-by-Step Tutorial for Beginners
The team at Think Media explains why Average View Duration is one of the most powerful levers you have for growth.
Watch the clip from 09:37 to 10:36. The speaker emphasizes how AVD acts as a direct signal to the algorithm that your content is valuable.
As the video highlights, getting someone to spend several minutes of their time on your content when they could be doing anything else is a massive vote of confidence.
3. The Goal: Conversions (Subscribers)
Views, CTR, and AVD are all crucial performance indicators, but they are means to an end. The ultimate goal, as we discussed in the last lesson, is to achieve a specific outcome or conversion.
On YouTube, the most fundamental conversion is turning a casual viewer into a subscriber. Subscribers are your core audience; they are more likely to watch future videos, contributing to your channel's momentum.
You can track subscribers gained (and lost) for your entire channel or on a per-video basis. This helps you understand which content is most effective at building your community.
YouTube Analytics Explained: Step-by-Step Tutorial for Beginners
Let's look at how to track subscribers within your analytics. This clip from Think Media shows how to see the subscriber impact of a single video.
Watch from 01:59 to 02:23. Notice how you can see a positive or negative subscriber number for each video you publish. This is direct feedback on how your content resonates with your audience.
While subscribers are the main on-platform conversion, remember our discussion about "owned land." In future lessons, we'll explore how to track off-platform conversions, like clicks to your personal website or sign-ups for an email list. For now, focus on subscribers as your primary conversion metric.
The Performance Funnel
Coming from a software engineering background, you're familiar with analyzing user funnels. A user might land on a page, click a button, fill out a form, and finally convert. YouTube analytics works the same way.
- Impressions (Top of Funnel): YouTube shows your video to potential viewers.
- CTR (First Gate): A percentage of those viewers click on your thumbnail.
- Views (Second Gate): You now have a viewer watching your video.
- AVD & Watch Time (Engagement): The viewer stays and consumes your content, generating watch time.
- Conversion (Goal): The engaged viewer is impressed and clicks the "Subscribe" button.
Every step of this funnel has a measurable rate. Your job as a performance-driven creator is to identify where users are dropping off and improve that specific step. A low CTR might mean your thumbnails need work. A low AVD might mean your video introductions aren't strong enough. We will dive deep into optimizing these in later modules.
Conclusion
Today, you've learned to navigate YouTube Studio and identify the vital signs of your channel's health. This is the foundational skill for making data-driven decisions instead of guessing what works.
Key Takeaways:
- YouTube Studio is your analytics dashboard, organized into tabs like Overview, Reach, Engagement, and Audience.
- Click-Through Rate (CTR) measures the effectiveness of your video's "packaging" (title and thumbnail). It's a key discovery metric found in the Reach tab.
- Average View Duration (AVD) and Watch Time measure how well your content holds viewer attention. They are key engagement metrics found in the Engagement tab.
- Subscribers are a primary conversion metric, indicating that your content is valuable enough for a viewer to want more. This is found in the Audience tab or on a per-video basis.
- These metrics form a performance funnel (Impressions → CTR → Views → AVD → Subscribers) that you can analyze to understand and improve your content's performance.
Preview of the Next Lesson:
Now that we've identified the core metrics, the next step is to connect them to a strategic framework. In our next lesson, we will map these metrics to the classic marketing funnel (Awareness, Consideration, Conversion, Retention) to define clear, strategic goals for your future YouTube channel.