Introduction
Welcome back! In our last lesson, you learned how to construct a data-driven business case to secure investment for content initiatives. You translated historical performance into compelling ROI projections, making a clear argument for future resources.
Today, we'll focus on what happens after your project is approved. How do you track performance against those projections and communicate the value your content is generating on an ongoing basis? This lesson addresses exactly that. Our learning outcome is to design the key metrics, layout, and visualizations for a content ROI dashboard.
A well-designed dashboard is the command center of your content engine. It transforms complex data into a clear, visual story about performance, enabling you to prove your impact, make smarter strategic decisions, and communicate your success to leadership.
1. Start with Why: Purpose and Audience
Before choosing a single metric or chart, the most critical step is to define the dashboard's purpose and audience. A dashboard for an executive needs to be different from one used by your content creation team.
A great dashboard tells a story. To understand the fundamental principles of dashboard design and storytelling with data, let's watch a video from Maven Analytics that outlines a six-step framework.
Telling a Story with Data | Dashboard Build Demo
This video, 'Telling a Story with Data', provides a foundational framework for dashboard design. We'll focus on the initial steps that are crucial for setting the right direction.
Please watch from the beginning until the timestamp 01:43. Pay close attention to the first two steps of the framework: Defining the purpose: Who is the audience and what questions do they need answered? Choosing the right metrics: How do you ensure your data aligns with business goals?
As the video highlights, your first questions should be:
- Who is this for? For a content ROI dashboard, your primary audience is likely executive leadership and the sales team leader.
- What is their goal? They want to understand how content marketing is contributing to revenue and business growth.
- What decisions will it drive? It should help them decide whether to increase, decrease, or reallocate the content budget.
For our purpose, we are designing a Content ROI Dashboard, which specifically connects content activities to business results. This is distinct from other dashboards that might focus on SEO performance or social media engagement, as outlined in the "Content Marketing Dashboard Types" section of the HockeyStack article you can refer to later.
2. Choosing Your Key Metrics: From Vanity to Value
With a clear purpose and audience, the next step is to select metrics that matter. For an executive-level ROI dashboard, this means moving beyond "vanity metrics" (like pageviews or social followers) and focusing on metrics that directly tie to business outcomes.
The article "Marketing Dashboard Design" from KEO Marketing provides an excellent breakdown of KPIs that secure executive buy-in.
Marketing Dashboard Design: KPIs & Executive Buy-In 2026
This article, 'Marketing Dashboard Design: KPIs & Executive Buy-In', is highly relevant for selecting metrics that demonstrate financial impact. It clearly distinguishes between metrics for executives and those for tactical teams.
Please read the following three sections: Start with 'Marketing KPIs That Drive Executive Buy-In' to understand the categories of metrics leaders care about. Then, find the subsection 'Content Marketing Dashboard' (it's under 'Building Channel Performance Dashboards'). Pay attention to the 'Impact Metrics' listed there. Finally, read 'Common Dashboard Design Mistakes' to learn what to avoid, especially Mistake #1 (Metric Overload) and #2 (Vanity Metrics Prominence). Focus on identifying 5-7 core metrics that tell a complete story of content's journey from engagement to revenue.
Based on these principles, here is a curated list of essential metrics for your Content ROI Dashboard:
Primary/Hero Metrics (The "So What?")
These directly answer the question, "Is our content generating a return?"
- Content-Influenced Revenue: Total revenue from closed deals where content was a touchpoint in the buyer's journey.
- Pipeline Generated from Content: The total value of sales opportunities created from content marketing leads (e.g., from a webinar or whitepaper download).
- Content Marketing ROI: The ultimate metric. Calculated as
(Gain from Content - Cost of Content) / Cost of Content.
Secondary/Diagnostic Metrics (The "How?")
These explain the performance of the primary metrics.
- Marketing Qualified Leads (MQLs) Generated: The number of leads from content that meet the criteria for marketing to nurture.
- Lead-to-Customer Conversion Rate: The percentage of leads originating from content that become paying customers. This measures lead quality.
- Customer Acquisition Cost (CAC) via Content: The average cost to acquire a customer through content marketing efforts.
3. Designing the Layout and Visualizations
Once you have your metrics, you need to arrange them in a way that is intuitive and easy to understand at a glance. We'll use a combination of strategic layout and effective chart selection.
The Three-Part Dashboard Structure
A highly effective structure for an executive dashboard, as mentioned in the KEO Marketing resource, is:
- Top: Hero Metrics. Display your 3-5 most important KPIs as large, prominent numbers (often called KPI cards). This gives an immediate summary of performance.
- Middle: Trend Analysis. Use line charts to show how your hero metrics are performing over time (e.g., Pipeline Generated month-over-month).
- Bottom: Breakdown & Details. Use bar charts or tables to provide one level of detail. For example, break down influenced revenue by content type (blog, webinar, case study) or campaign.
The layout should guide the viewer's eye naturally. Most people in Western cultures read in a "Z" or "F" pattern, starting at the top-left. Therefore, your most critical information should be placed there.
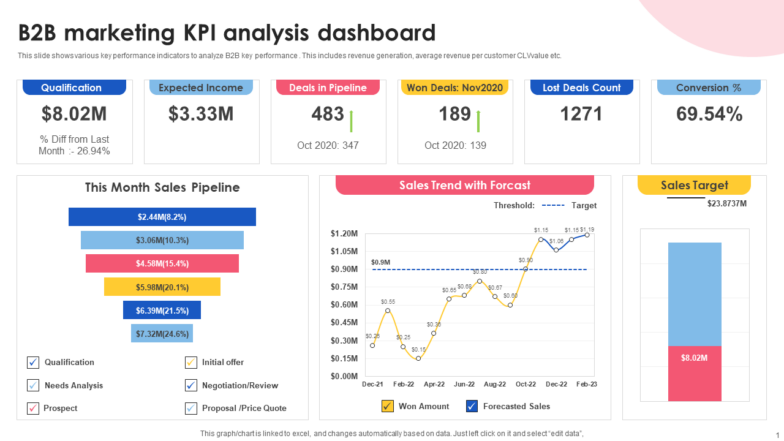
Choosing the Right Visualizations
Selecting the right chart type is crucial for clarity. Simplicity is key.
Telling a Story with Data | Dashboard Build Demo
Let's return to the 'Telling a Story with Data' video to focus on chart selection and layout principles.
Watch the segment from 06:18 to 07:29, and then from 01:43 to 02:32. Focus on these key ideas: Presenting data effectively (06:18 - 07:29): Matching metrics to simple chart types like line charts, KPI cards, and bar charts. Eliminating clutter (01:43 - 02:07): The importance of removing non-essential elements to improve clarity. Using layout to focus attention (02:07 - 02:32): Grouping related items and using common reading patterns (Z-pattern).
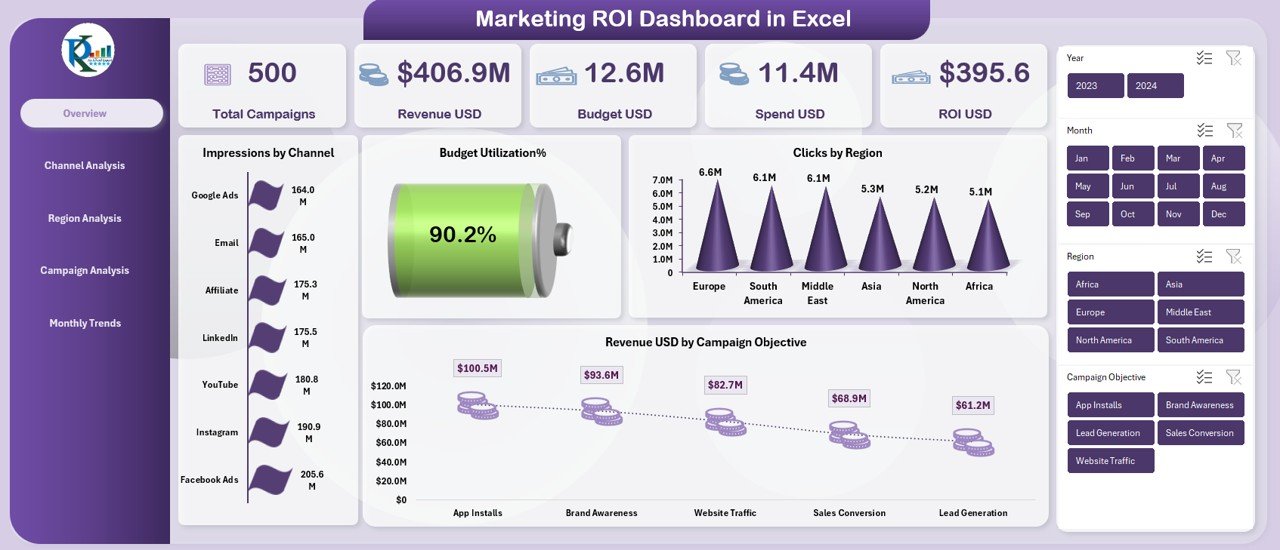
Here are the best practices for visualization:
- KPI Cards: Use for single, critical numbers (e.g., Total Content ROI).
- Line Charts: Ideal for showing trends over time (e.g., Monthly Influenced Revenue).
- Bar/Column Charts: Best for comparing categories (e.g., Pipeline Generated by Content Type).
- Funnel Charts: Excellent for visualizing conversion rates through stages (e.g., MQL > SQL > Customer).
- Tables: Use for providing detailed, granular data when needed (e.g., performance of the top 10 blog posts).
Finally, use color purposefully. Use one color for your main data, and use accent colors like green or red sparingly to indicate good or bad performance against a target. Avoid the "rainbow effect" which can be distracting.
4. Activity: Sketch Your Dashboard
Now it's time to put these principles into practice. In the previous lesson, you drafted a mini business case to secure a $12,000 budget for a 3-webinar series, projecting it would generate $120,000 in revenue.
Your task now is to design the dashboard you would use to report on the performance of this webinar series to your manager.
Your Task (15 minutes):
On a piece of paper or using a simple digital tool (like PowerPoint or a whiteboard app), sketch a layout for this dashboard.
- Identify your 3 "hero" metrics. What are the most important numbers your manager wants to see at a glance? Place them at the top.
- Choose a primary trend chart. What metric would you want to track over time for this webinar series?
- Choose one breakdown chart. How would you compare the performance of the three individual webinars?
- For each element, specify the visualization type you would use (e.g., KPI Card, Line Chart, Bar Chart).
- Give your charts descriptive titles (e.g., "Pipeline Generated per Webinar" instead of just "Pipeline").
This exercise is about applying the design logic, not creating a pixel-perfect graphic.
Click here to see a sample sketch and explanation.
Here is one possible way to design the dashboard:
Dashboard Title: Q3 Webinar Series Performance
(Top Section: Hero Metrics - Using KPI Cards)
| Total Revenue Influenced | Total Pipeline Generated | Overall ROI | Total Leads (MQLs) |
|---|---|---|---|
| $75,000 | $150,000 | 525% | 850 |
| (vs. Target $120k) | (vs. Target $200k) | (vs. Target 900%) | (vs. Target 1200) |
(Middle Section: Trend Analysis - Using a Line Chart)
Chart Title: Cumulative Pipeline Generated Over Time
- Y-Axis: Pipeline Value ($)
- X-Axis: Weeks (1-12)
- Line 1: Actual Cumulative Pipeline
- Line 2: Projected Pipeline Goal (a straight or stepped line showing the target)
(Bottom Section: Breakdown Analysis - Using a Bar Chart)
Chart Title: Performance Breakdown by Webinar
- Y-Axis: Value ($)
- X-Axis: Webinar 1, Webinar 2, Webinar 3
- Bars: Stacked or grouped bars showing two metrics for each webinar:
- Pipeline Generated (e.g., in blue)
- Revenue Influenced (e.g., in green)
Rationale for this design:
- It follows the Top-Middle-Bottom structure, providing information from most to least critical.
- The hero metrics at the top give an instant status update against the goals you set in your business case.
- The line chart shows momentum and progress towards the overall pipeline goal.
- The bar chart allows for quick comparison to see which webinar was most effective, informing future content strategy.
- The titles are descriptive, telling the viewer exactly what they are looking at.
Conclusion
In this lesson, you learned the core principles for designing a powerful content ROI dashboard. You now have a framework for moving beyond simply collecting data to presenting it in a way that tells a clear, compelling story about your content's financial impact.
Key Takeaways:
- Audience First: Design your dashboard for your audience (e.g., executives) and their specific goals.
- Metrics with Meaning: Focus on business-impact metrics like influenced revenue, pipeline, and ROI, not vanity metrics.
- Structure for Clarity: Use a hierarchical layout (Hero Metrics, Trends, Breakdowns) to guide your audience through the data logically.
- Visualize Simply: Choose the right chart for the job (line for trends, bar for comparisons) and keep your designs clean and uncluttered.
Preview of the Next Lesson:
You've designed the blueprint for your dashboard. The next logical step is to build it. In our next lesson, you will build a prototype of a content ROI dashboard using a spreadsheet with sample data. This will be a hands-on session where you'll translate your design into a functional tool.