Introduction
Welcome back. In our last lesson, you did an excellent job designing the blueprint for a content ROI dashboard, sketching out the key metrics, layout, and visualizations needed to tell a story about your content's financial impact. You have the 'what' and the 'why'; today, we focus on the 'how'.
This lesson is dedicated to our learning outcome: Build a prototype of a content ROI dashboard using a spreadsheet with sample data. We will move from the drawing board to a functional tool. You'll set up a raw data source, use powerful spreadsheet functions to aggregate that data, and create the charts and KPI cards you designed previously. Given your background in Computer Applications, you'll find that structuring and querying data in a spreadsheet shares many logical principles with database management.
By the end of this lesson, you will have a tangible, working prototype that can serve as the foundation for your actual content ROI reporting.
1. The Foundation: Structuring Your Raw Data
Every powerful dashboard is built on a foundation of clean, well-structured raw data. Before we can visualize anything, we need a source of truth. We will create a dedicated tab in a spreadsheet that acts as a simple database for all our content marketing activities.
The goal is to log each piece of content or campaign and associate it with its costs and performance metrics. This disciplined approach is what allows you to connect specific efforts to revenue outcomes. The article from Cometly provides a great overview of why this central tracker is so crucial.
Master Your Marketing Campaign Tracking Spreadsheet
To understand the strategic importance of what we're about to build, please read a short section from the article 'Master Your Marketing Campaign Tracking Spreadsheet' by Cometly.
Read the first two sections, 'Why You Need a Central Tracking Spreadsheet' and 'Core Components of an Effective Tracking Spreadsheet'. Focus on how a central spreadsheet transforms scattered data into a clear story about what's working.
For our Content ROI dashboard, the "core components" will be specific to content marketing. We'll set up a Data tab with the following columns:
- Content_Title: The name of the asset (e.g., "Q3 Webinar: AI in Marketing").
- Content_Type: The format (e.g., Webinar, Blog Post, Case Study, Whitepaper).
- Funnel_Stage: The primary funnel stage it targets (TOFU, MOFU, BOFU).
- Publish_Date: The date the content went live.
- Cost: The direct cost to produce the content (e.g., freelance writer fees, software, design).
- Leads_Generated: The number of new MQLs attributed to this content.
- Pipeline_Influenced: The dollar value of sales opportunities this content touched.
- Revenue_Generated: The dollar value of closed-won deals attributed to this content.
Sample Data for Your Prototype
For today's activity, you'll use the following sample data. This is what you will place in your Data tab.
| Content_Title | Content_Type | Funnel_Stage | Publish_Date | Cost | Leads_Generated | Pipeline_Influenced | Revenue_Generated |
|---|---|---|---|---|---|---|---|
| The Ultimate SEO Checklist | Blog Post | TOFU | 2023-01-15 | $500 | 150 | $15,000 | $2,500 |
| Case Study: Acme Corp | Case Study | BOFU | 2023-02-20 | $1,200 | 25 | $50,000 | $25,000 |
| Webinar: The Future of ABM | Webinar | MOFU | 2023-03-10 | $4,000 | 300 | $120,000 | $30,000 |
| How to Choose a CRM | Blog Post | MOFU | 2023-04-05 | $750 | 80 | $25,000 | $5,000 |
| Q2 Product Update | Blog Post | BOFU | 2023-05-01 | $300 | 10 | $5,000 | $1,000 |
| Whitepaper: State of Sales | Whitepaper | TOFU | 2023-06-22 | $2,500 | 450 | $90,000 | $10,000 |
| ROI Calculator Template | Tool | MOFU | 2023-07-18 | $1,000 | 200 | $60,000 | $15,000 |
| Case Study: Globex Inc. | Case Study | BOFU | 2023-08-30 | $1,200 | 35 | $75,000 | $40,000 |
2. The Engine Room: Aggregating Data with QUERY
With our data in place, we need a way to summarize it. Instead of manual calculations or complex pivot tables, we will use Google Sheets' QUERY function. This function uses a syntax similar to SQL, which should feel familiar given your computer science background. It allows you to select, filter, and aggregate data with remarkable flexibility.
The video below provides an excellent step-by-step guide to using the QUERY function to build the summary tables that will power our dashboard.
How to Build a Professional Dashboard in Google Sheets (Query Formula Advanced Course) Step-by-Step
The video 'How to Build a Professional Dashboard in Google Sheets' by Hustlesheets will be our main technical guide. We'll start by learning the basics of the QUERY formula to aggregate our raw data.
Please watch from 18:46 to 28:00. The instructor uses a sales dataset, but the principles are identical. Focus on understanding the structure of the QUERY formula, particularly: SELECT: Choosing which columns to display or calculate (e.g., sum(H) for Revenue). WHERE: Filtering out rows (e.g., ignoring empty rows). GROUP BY: Aggregating data by a specific category (e.g., group by B for Content_Type). LABEL: Renaming the output columns for clarity.
By using a QUERY formula, you can create a dynamic summary table on your dashboard that automatically updates whenever you add new data to your Data tab. For example, a query could summarize Pipeline_Influenced and Revenue_Generated for each Content_Type.
3. The Interface: Visualizing the Results
Now for the rewarding part: turning your aggregated data into the clean, intuitive visuals you designed in the last lesson. Your goal is to create a dashboard that tells a story at a glance.
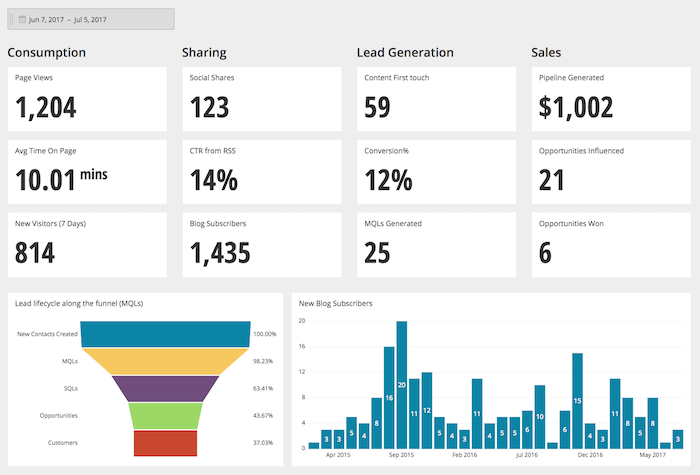
Creating these visuals is straightforward once your QUERY is set up:
- KPI Cards ("Hero Metrics"): These are just individual cells on your dashboard that directly reference the summary cells from your
QUERYoutput (e.g., a cell displaying the grand total forRevenue_Generated). - Charts and Graphs: You can create charts directly from the summary table generated by your
QUERYformula.
Let's return to the Hustlesheets video to see how to create charts from the data we've just aggregated.
How to Build a Professional Dashboard in Google Sheets (Query Formula Advanced Course) Step-by-Step
This segment demonstrates how to insert and customize charts based on your queried data.
Watch from 34:49 to 40:47. Pay attention to how the instructor highlights the data from the query output and uses the 'Insert Chart' function. Notice how he customizes the chart, such as changing the chart type, editing titles, and adjusting axes. You will apply these same steps to visualize your content data.
4. Activity: Build Your Dashboard Prototype
It's time to build. Open a new Google Sheet and let's create your prototype.
Estimated time: 25 minutes
-
Set Up Your Sheet:
- Create a new Google Sheet.
- Rename the first tab to
Dashboard. - Create a second tab and name it
Data.
-
Populate Raw Data:
- Copy the sample data table from Part 1 of this lesson.
- Paste it into the
Datatab, starting at cell A1.
-
Create a Summary Query:
- On the
Dashboardtab, in cell A10, write aQUERYformula to summarize performance byContent_Type. This query should show theContent_Type, the sum ofPipeline_Influenced(Column G), and the sum ofRevenue_Generated(Column H). - Your formula will look something like this:
=QUERY(Data!A:H, "SELECT B, SUM(G), SUM(H) WHERE B IS NOT NULL GROUP BY B LABEL SUM(G) 'Total Pipeline', SUM(H) 'Total Revenue'")
- On the
-
Create Hero Metrics (KPI Cards):
- On the
Dashboardtab, find a prominent spot (e.g., cell B2). - In cell B2, type the label "Total Revenue Generated".
- In cell B3, write a formula to sum all the revenue from your
Datatab:=SUM(Data!H:H). Format this cell as currency. - In cell D2, type "Total Pipeline Influenced".
- In cell D3, write the formula:
=SUM(Data!G:G). Format this as currency.
- On the
-
Create a Visualization:
- On the
Dashboardtab, highlight the data generated by yourQUERYformula (the summary of performance by content type, e.g., A10:C15). - Go to
Insert>Chart. - Choose a Column Chart or Bar Chart.
- Give your chart a clear title, like "Pipeline vs. Revenue by Content Type".
- Position this chart below your hero metrics.
- On the
Once you complete these steps, you will have a simple but functional dashboard prototype that automatically reflects the data in your Data tab.
5. Taking It Further: Interactive Filters
A static dashboard is good, but an interactive one is even better. A common feature is allowing the user to filter the data by a date range. This can be achieved by adding a start and end date selector to your dashboard and incorporating it into your QUERY formula.
This is an optional but highly recommended step to make your prototype more powerful.
How to Build a Professional Dashboard in Google Sheets (Query Formula Advanced Course) Step-by-Step
Let's watch one last clip from the Hustlesheets video to learn how to add dynamic date filters.
Watch from 43:58 to 50:15. This section explains how to add 'Start Month' and 'End Month' dropdowns and integrate them into the WHERE clause of the QUERY formula. The syntax is a bit tricky, but the instructor breaks it down clearly. Applying this logic will allow a user to dynamically control the data displayed on your dashboard.
Conclusion
Congratulations! You've successfully translated a conceptual design into a working dashboard prototype. This is a critical skill for demonstrating the value of your content engine and making data-informed strategic decisions.
Key Takeaways:
- Structure is Key: A robust dashboard requires a clean, well-structured
Datasource tab. QUERYis Your Power Tool: TheQUERYfunction in Google Sheets is a flexible and powerful way to aggregate and summarize your data without relying on manual calculations.- Visualize for Impact: Use a combination of KPI cards for high-level summaries and charts for trend and comparison analysis to tell a clear story.
- Prototype to Perfect: Building a prototype with sample data allows you to test your logic and design before deploying it with real, live data.
Preview of the Next Lesson:
You now have a dashboard that shows the numbers. The final step is to build a narrative around them. In our next lesson, we will focus on how to practice presenting content performance results to leadership in revenue-focused terms, using the very dashboard you've just built as your primary tool.