Hello! Welcome to the second lesson in our Cardiology series.
In our previous lesson, we mastered the art of cardiac physical examination. We learned how a sustained, heaving apex beat can suggest left ventricular pressure overload (like in aortic stenosis), or how a fixed split S2 is a classic sign of an atrial septal defect. Today, we will bridge those physical findings to their electrical signatures on a 12-lead ECG. Your goal of attaining a thorough, integrated knowledge of cardiology requires mastering this crucial diagnostic tool.
This lesson is designed to help you interpret complex 12-lead ECGs. We will move beyond the basics of rate and rhythm to focus on four key areas:
- QRS Axis Deviation and its link to Fascicular Blocks.
- Chamber Hypertrophy and Enlargement.
- Bundle Branch Blocks (RBBB and LBBB).
- Bifascicular Blocks, which combine these conduction delays.
By the end of this session, you'll be able to confidently identify these important ECG patterns, which are essential for both your exams and clinical practice.
A Systematic Approach to ECG Interpretation
Before diving into specific abnormalities, it's crucial to adopt a systematic approach to reading every ECG. This prevents you from missing subtle but important findings. A widely used method is the 5-step approach.
Introduction To ECG Interpretation January 2023
Let's begin by reviewing a structured method for ECG interpretation. This guide by Dr. Frank Yanowitz from the University of Utah provides an excellent framework.
Please read the section 'A 5-Step Method of ECG Interpretation' (pages 38-40 in the PDF). Focus on the five core components: Measurements, Rhythm, Conduction, Waveform, and Interpretation. We will be applying this structure as we analyze the abnormalities in this lesson.
For today's lesson, we will focus on specific components of this framework:
- Measurements: QRS Axis and QRS duration.
- Conduction Analysis: Intraventricular (IV) blocks, including fascicular and bundle branch blocks.
- Waveform Analysis: P-wave morphology (atrial enlargement) and QRS morphology (ventricular hypertrophy).
1. QRS Axis Deviation and Fascicular Blocks
The QRS axis represents the average direction of ventricular depolarization in the frontal plane. A deviation from the normal axis is often the first clue to an underlying conduction problem or structural heart disease.
Determining the Axis
A quick way to determine the axis is by looking at the net deflection of the QRS complex in Lead I and Lead aVF.
- Normal Axis (-30° to +90°): QRS is positive in both Lead I and aVF. (Two thumbs up)
- Left Axis Deviation (LAD) (-30° to -90°): QRS is positive in Lead I and negative in aVF. (Thumbs pointing away from each other)
- Right Axis Deviation (RAD) (+90° to +180°): QRS is negative in Lead I and positive in aVF. (Thumbs pointing towards each other)
- Extreme Axis Deviation (-90° to -180°): QRS is negative in both Lead I and aVF. (Two thumbs down)
Fascicular Blocks (Hemiblocks)
The left bundle branch divides into two fascicles: the left anterior fascicle (LAF) and the left posterior fascicle (LPF). A block in one of these fascicles is called a hemiblock. This does not typically widen the QRS complex, but it causes a significant axis shift.
Introduction To ECG Interpretation January 2023
Now, let's connect axis deviation to its most common cause: fascicular blocks. The same guide by Dr. Yanowitz provides clear diagrams and explanations.
Please review pages 49 to 57 in the PDF. Focus on: The definitions of Normal Axis, LAD, and RAD (page 53). The diagrams explaining Left Anterior Fascicular Block (LAFB) as a cause of LAD (page 55). Note that Left Posterior Fascicular Block (LPFB) is a cause of RAD (page 56), but it is much rarer than LAFB.
-
Left Anterior Fascicular Block (LAFB):
- This is the most common cause of marked Left Axis Deviation (axis typically -45° to -90°).
- The electrical impulse travels down the posterior fascicle first, causing initial depolarization in an inferior-to-superior and right-to-left direction.
- ECG Criteria:
- Left Axis Deviation (QRS positive in I, negative in aVF and II).
- Small q-wave in Lead I and aVL.
- Small r-wave and deep S-wave (rS pattern) in leads II, III, and aVF.
- Normal QRS duration (< 0.12s).
-
Left Posterior Fascicular Block (LPFB):
- This is rare. It causes Right Axis Deviation (axis typically +90° to +180°).
- You must exclude other, more common causes of RAD (e.g., RVH, lateral MI, COPD) before diagnosing LPFB.
- ECG Criteria:
- Right Axis Deviation.
- Small r-wave and deep S-wave (rS pattern) in Lead I and aVL.
- Small q-wave and tall R-wave (qR pattern) in leads II, III, and aVF.
- Normal QRS duration (< 0.12s).
2. Chamber Hypertrophy and Enlargement
When a chamber works against high pressure (e.g., hypertension, aortic stenosis) or handles excess volume (e.g., regurgitant valves), its muscle mass increases (hypertrophy) or its size increases (enlargement). This increased muscle mass generates more voltage, which is reflected on the ECG.
Intro to EKG Interpretation - Chamber Enlargement
This detailed video from Strong Medicine explains the ECG changes in atrial enlargement and ventricular hypertrophy, linking them directly to the underlying pathophysiology.
Please watch the following segments carefully: Atrial Enlargement (5:10 - 10:27): Focus on the P-wave changes in Lead II and V1 for Right Atrial Enlargement (RAE) and Left Atrial Enlargement (LAE). Ventricular Hypertrophy Pathophysiology (13:18 - 15:53): Understand how RVH and LVH alter the normal QRS vectors in the precordial leads. Summary & Criteria (18:35 - 24:26): Pay close attention to the summary of findings for RVH and LVH. Critically, learn the Sokolow-Lyon and Cornell voltage criteria for LVH, as these are frequently tested.
Atrial Enlargement (P-wave abnormalities)
- Right Atrial Enlargement (RAE) - "P Pulmonale":
- Caused by conditions increasing right atrial pressure (e.g., pulmonary hypertension, COPD, tricuspid stenosis).
- Criteria: Tall, peaked P-wave > 2.5 mm in Lead II.
- Left Atrial Enlargement (LAE) - "P Mitrale":
- Caused by conditions increasing left atrial pressure (e.g., mitral stenosis/regurgitation, LVH).
- Criteria:
- Notched, broad P-wave > 0.12s (3 small squares) in Lead II.
- Biphasic P-wave in V1 with a prominent terminal negative portion (> 1 mm deep and > 0.04s wide).
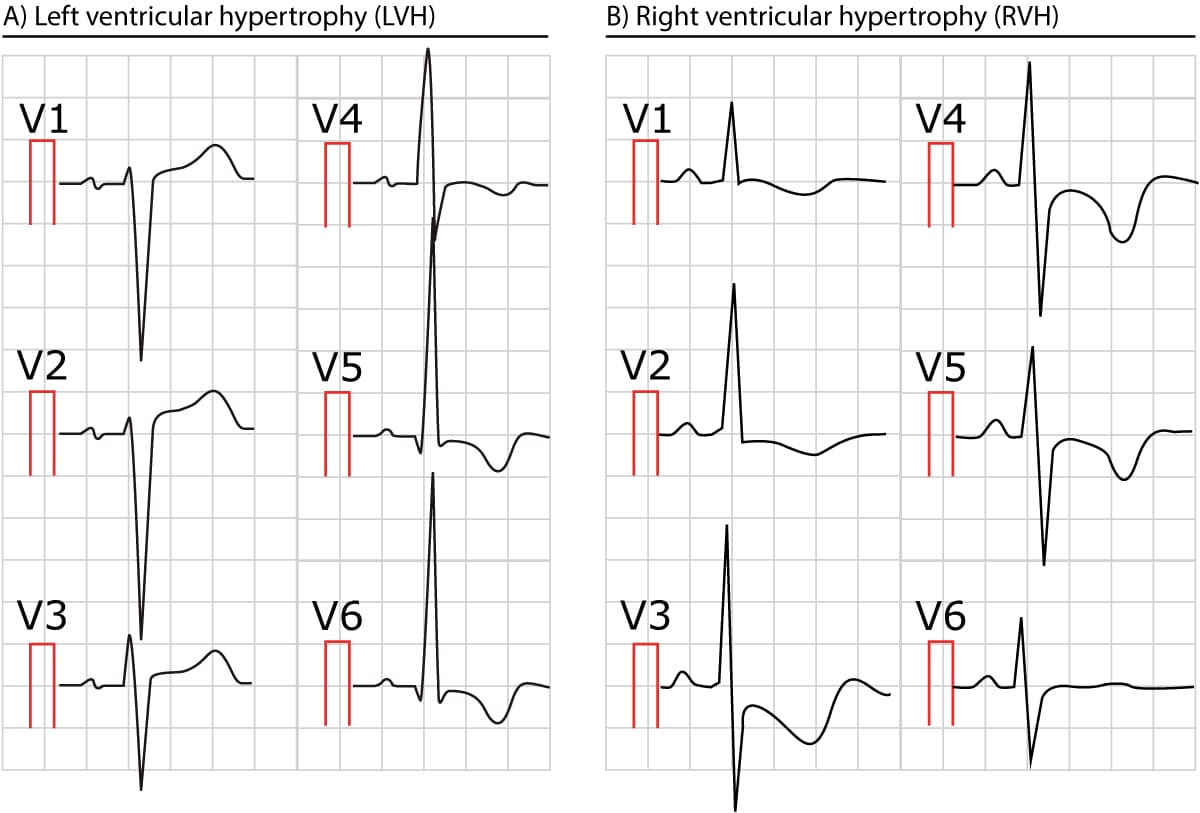
Ventricular Hypertrophy (QRS abnormalities)
-
Left Ventricular Hypertrophy (LVH):
- Characterized by increased QRS voltage in the leads overlying the left ventricle.
- Voltage Criteria (learn these):
- Sokolow-Lyon: S in V1 + R in V5 or V6 > 35 mm.
- Cornell: R in aVL + S in V3 > 28 mm (men) or > 20 mm (women).
- Other features: Left axis deviation, secondary repolarization abnormalities ("strain pattern" - ST depression and T-wave inversion in lateral leads I, aVL, V5, V6).
-
Right Ventricular Hypertrophy (RVH):
- Characterized by a reversal of the normal R-wave progression in precordial leads.
- Criteria:
- Right Axis Deviation (> +90°).
- Dominant R-wave in V1 (R > S).
- Dominant S-wave in V6 (S > R).
- Other features: RAE, "strain pattern" in right-sided leads (V1, V2, III, aVF).
Test your understanding!
An ECG of a 65-year-old man with long-standing hypertension shows the following: S-wave in V1 is 20 mm, and the R-wave in V5 is 22 mm. The QRS axis is -40 degrees. What are the two key ECG diagnoses?
Show answer
- Left Ventricular Hypertrophy (LVH): The sum of the S in V1 (20 mm) and R in V5 (22 mm) is 42 mm. This is greater than 35 mm, meeting the Sokolow-Lyon criteria for LVH.
- Left Axis Deviation (LAD): An axis of -40 degrees is beyond the normal limit of -30 degrees. This is likely due to the LVH itself or a co-existing Left Anterior Fascicular Block (LAFB).
3. Bundle Branch and Bifascicular Blocks
When conduction through the right or left bundle branch is blocked, the depolarization of the affected ventricle is delayed. It has to be activated slowly through cell-to-cell conduction from the other ventricle. This delay results in a wide QRS complex (≥ 0.12 seconds).
Intro to EKG Interpretation - Bundle Branch Blocks
This excellent video, also from Strong Medicine, focuses entirely on intraventricular conduction delays. It clearly explains the pathophysiology and ECG criteria for RBBB, LBBB, and the combination blocks.
Please watch the following segments: Pathophysiology (2:14 - 3:16): Understand why a bundle branch block causes a wide QRS complex. RBBB Pattern (4:43 - 6:19): Focus on the classic rSR' ('bunny ears') pattern in V1 and the wide, slurred S-wave in V6. LBBB Pattern (6:19 - 7:17): Note the broad, monophasic R-wave in V6 and the deep QS or rS complex in V1. Formal Criteria (7:44 - 10:03): Review the specific diagnostic criteria for complete RBBB and LBBB. Bifascicular Block (16:52 - 17:44): Learn how RBBB can combine with a fascicular block.

Right Bundle Branch Block (RBBB)
- Pathophysiology: The RV is depolarized late via impulses from the LV.
- Key Features:
- Wide QRS (≥ 0.12s).
- rSR' pattern in V1/V2 ("M" shape or "bunny ears"). The R' represents the delayed depolarization of the RV.
- Wide, slurred S-wave in lateral leads (I, aVL, V5, V6). This represents the late impulse moving away from these leads towards the RV.
Left Bundle Branch Block (LBBB)
- Pathophysiology: The LV is depolarized late via impulses from the RV. Septal depolarization is also reversed (right-to-left).
- Key Features:
- Wide QRS (≥ 0.12s).
- Broad, monophasic (or notched) R-wave in lateral leads (I, aVL, V5, V6). No septal q-waves in these leads.
- Broad, deep S-wave in V1/V2 (often a QS pattern).
- The axis is often leftward but can be normal.
Bifascicular and Trifascicular Blocks
These are combinations of the blocks we've discussed and are clinically significant as they can progress to complete heart block.
-
Bifascicular Block: A block of two of the three main fascicles (RBB, LAF, LPF).
- RBBB + LAFB (Most Common): The ECG shows criteria for RBBB (wide QRS, rSR' in V1) PLUS criteria for LAFB (Left Axis Deviation).
- RBBB + LPFB (Rare): The ECG shows criteria for RBBB PLUS criteria for LPFB (Right Axis Deviation).
-
Trifascicular Block: This term can be confusing.
- Incomplete Trifascicular Block: Clinically, this usually refers to a bifascicular block (e.g., RBBB + LAFB) with a prolonged PR interval (1st-degree AV block). This implies disease in the third remaining fascicle.
- Complete Trifascicular Block: This results in complete (3rd degree) AV block.
Test your understanding!
An ECG shows a QRS duration of 0.14s. Lead V1 shows a tall R' wave, making an 'M' shape. Lead I is upright, but Lead aVF is negative. What is the complete diagnosis?
Show answer
The complete diagnosis is Right Bundle Branch Block with Left Anterior Fascicular Block (a bifascicular block).
- The QRS duration > 0.12s and the M-shape (rSR') in V1 establish the diagnosis of RBBB.
- Lead I being positive and Lead aVF being negative establishes Left Axis Deviation. In the setting of RBBB, this is due to a concomitant LAFB.
Conclusion
Congratulations on working through these complex but essential ECG patterns. You have now built a framework for identifying the electrical signs of structural heart disease and conduction system failure.
Key Takeaways:
- Axis Deviation: A quick look at Leads I and aVF determines the axis. LAD is often caused by LAFB, while RAD (after excluding other causes) can be due to LPFB.
- Chamber Hypertrophy: Look for tall P-waves (RAE) or broad, notched P-waves (LAE). For ventricles, it's about voltage: LVH causes high voltage in left-sided leads (V5-V6), while RVH causes a dominant R-wave in V1.
- Bundle Branch Blocks: The key is a wide QRS (≥ 0.12s). The morphology in V1 and V6 is crucial for differentiation: an M-shape in V1 suggests RBBB, while a W-shape in V1 and M-shape in V6 suggest LBBB (the "WiLLiaM MaRRoW" mnemonic).
- Bifascicular Blocks: Identify the underlying RBBB first, then check the axis. If there's LAD, it's RBBB+LAFB. If there's RAD, it's RBBB+LPFB.
The ability to integrate these ECG findings with the clinical signs from our previous lesson will significantly sharpen your diagnostic acumen.
In our next lesson, we will add another piece to our diagnostic puzzle by learning to systematically interpret chest X-rays, focusing on cardiac contour, chamber enlargement, and signs of pulmonary venous hypertension. You'll see how the signs of LVH on an ECG often correspond to an enlarged cardiac silhouette on a chest X-ray.