Hello! Welcome to the third lesson in our Cardiology diagnostics module.
In our last lesson, we focused on the ECG, learning to identify the electrical signatures of chamber hypertrophy and conduction blocks. We saw how conditions like long-standing hypertension could lead to voltage criteria for Left Ventricular Hypertrophy (LVH) on an ECG. Today, we will shift from the electrical to the anatomical, learning how to see the physical manifestations of these conditions on a chest X-ray (CXR). The CXR is a fundamental tool that provides a wealth of information not just about the heart's size and shape, but also about its impact on the lungs.
This lesson is designed to help you systematically interpret chest X-rays for cardiac contour, chamber enlargement, and signs of pulmonary venous hypertension. Your goal of achieving exhaustive knowledge requires mastering this cornerstone of cardiac imaging. We will cover:
- A systematic approach to CXR interpretation, including quality checks.
- How to assess the cardiac silhouette and identify signs of specific chamber enlargement.
- How to recognize the radiographic signs of elevated left-sided heart pressures (pulmonary venous hypertension).
By the end of this lesson, you'll be able to confidently extract key cardiothoracic information from a CXR, a skill indispensable for your exams and future clinical practice.
1. A Systematic Approach to CXR Interpretation
Before you can diagnose pathology, you must have a reliable system for reading every film. This ensures you don't miss subtle findings and that your interpretation is based on a high-quality image.
A great place to start is with the RIPE mnemonic for quality assessment and the ABCDE method for systematic review.
Chest X-ray Interpretation | How to Read a CXR | OSCE Guide | UKMLA | CPSA | PLAB 2
This video from Geeky Medics provides an excellent, structured guide to CXR interpretation. It will form the foundation of our approach.
Please watch the following segments: Assessing Quality (1:57 - 5:15): Focus on the 'RIPE' mnemonic. Pay close attention to the difference between PA (posteroanterior) and AP (anteroposterior) projections and why this is critical for assessing heart size. ABCDE Approach (5:15 - 6:04): Familiarize yourself with the components of this systematic review. Assessing the Heart (12:56 - 14:32): This section introduces the cardiothoracic ratio (CTR) as a measure of heart size.
Key Principles of CXR Interpretation
Based on the video, let's solidify some core principles:
-
Image Quality (RIPE):
- Rotation: The medial ends of the clavicles should be equidistant from the spinous processes.
- Inspiration: You should be able to count 5-6 anterior ribs or 8-10 posterior ribs above the diaphragm. A poor inspiratory effort can make the heart appear artificially large.
- Projection: A Posteroanterior (PA) film is the standard for cardiac assessment. The heart is closer to the detector, minimizing magnification. An Anteroposterior (AP) film, often taken on portable machines for unwell patients, magnifies the cardiac silhouette, making the heart appear larger than it is. Never assess for cardiomegaly on an AP film.
- Exposure: You should be able to see the thoracic vertebrae behind the heart.
-
Cardiac Size: The Cardiothoracic Ratio (CTR)
As you learned in the video, the CTR is a simple tool to estimate heart size on a PA film.- Calculation: (Maximum horizontal cardiac diameter) / (Maximum internal thoracic diameter).
- Normal: < 0.5 or 50%.
- A CTR > 0.5 suggests cardiomegaly. However, remember this is a screening tool, and factors like a poor inspiratory effort, obesity, or a pericardial effusion can also increase the CTR.
2. Analyzing Cardiac Contour and Chamber Enlargement
Once you've assessed the overall size, the next step is to examine the specific contours of the heart to infer which chamber might be enlarged. This is where you correlate your ECG findings with anatomical changes.
To do this effectively, you need to know which part of the cardiac silhouette is formed by which chamber.
Identifying Heart Chambers and Heart Valves on Frontal and Lateral Chest X-Rays [UndergroundMed]
This short, clear video uses CT scans to show which chambers form the borders of the heart on frontal and lateral X-rays. This will help you visualize the anatomy.
Watch the entire video (0:10 - 3:53). Focus on how the right atrium, right ventricle, left atrium, and left ventricle each contribute to the cardiac borders on both PA and lateral views.
Now, let's dive into the specific signs for each chamber's enlargement. We'll use a detailed slide deck as our primary reference for this section.
Radiographic approach to cardiac enlargement | PPTX
This presentation provides a comprehensive, textbook-level overview of the radiographic signs of chamber enlargement. It's an excellent resource for the 'exhaustive' detail you're looking for.
We will refer to this presentation for each chamber. For now, get a sense of the layout. You'll see it covers Left Atrial, Left Ventricular, Right Atrial, and Right Ventricular enlargement, as well as Pericardial Effusion.
Let's break it down chamber by chamber.
Left Atrial Enlargement (LAE)
This is a classic finding, especially in the context of mitral valve disease (e.g., mitral stenosis, which you might know causes "P mitrale" on the ECG).
- Key Signs on PA View:
- Double Density Sign: The enlarged LA pushes back and to the right, creating a second contour visible through the right atrium.
- Splaying of the Carina: The LA sits just below the carina. As it enlarges superiorly, it pushes the main bronchi apart, increasing the carinal angle to > 90°.
- Straightening of the Left Heart Border: The contour just below the pulmonary artery, which is normally concave, becomes straight or convex due to the enlarged left atrial appendage. This is sometimes called the "Third Mogul Sign".

*This image contrasts a normal heart with one showing left atrial enlargement. Note the prominent left atrial appendage creating a convex bulge on the left heart border, the 'Third Mogul Sign'.*
- For more detail, review the "Left atrial enlargement" slides in the
Radiographic approach to cardiac enlargementpresentation (slides 29-38).
Left Ventricular Enlargement (LVE)
Often a consequence of hypertension or aortic valve disease, LVE corresponds to the high voltage you see on an ECG.
-
Key Signs on PA View:
- Apex Displacement: The cardiac apex is displaced inferiorly and to the left.
- Rounding of the Apex: The normally sharp apex becomes blunted and rounded.
-
Key Sign on Lateral View:
- The posterior border of the LV projects posterior to the inferior vena cava.
-
For more detail, review the "Left ventricular enlargement" slides in the presentation (slides 39-45).
Right Ventricular Enlargement (RVE)
Commonly seen with pulmonary hypertension or congenital heart diseases like an Atrial Septal Defect (ASD).
-
Key Signs on PA View:
- Apex Elevation: The enlarged RV pushes the LV upwards, causing the cardiac apex to be lifted off the diaphragm. This can create a "boot-shaped" heart, or coeur en sabot.
-
Key Sign on Lateral View:
- Retrosternal Space Filling: The RV is the most anterior chamber. As it enlarges, it fills the normally lucent (dark) retrosternal space behind the sternum.
-
For more detail, review the "Right ventricular enlargement" slides in the presentation (slides 52-54).
Right Atrial Enlargement (RAE)
Often due to tricuspid valve disease or secondary to RV failure.
-
Key Sign on PA View:
- The right heart border, formed by the RA, becomes more convex and is displaced further to the right.
-
For more detail, review the "Right atrial enlargement" slides in the presentation (slides 46-51).
Test your understanding!
A patient with rheumatic heart disease has a CXR showing a carinal angle of 100° and a "double density" sign along the right heart border. Which chamber is most likely enlarged, and what valvular lesion is the most probable cause?
Show answer
The enlarged chamber is the Left Atrium. The splaying of the carina (>90°) and the double density sign are classic features of LAE. In the context of rheumatic heart disease, the most probable cause is Mitral Stenosis.
A Critical Mimic: Pericardial Effusion
It's crucial to differentiate true cardiomegaly from a pericardial effusion, which is fluid in the pericardial sac. A large effusion can also cause an enlarged cardiac silhouette but for a very different reason.
-
Key Signs of Pericardial Effusion:
- Globular or "Water-Bottle" Heart: The cardiac silhouette is enlarged and flask-shaped with smooth borders. Specific chamber contours are lost.
- Rapid change in cardiac size on serial X-rays.
- The lung fields are often clear (oligaemic) unless there is associated heart failure or inflammation.
-
Review the "Pericardial effusion" slides in the presentation (slides 55-56) for a visual. The resource from Radiology Assistant also has excellent examples comparing cardiomegaly and effusion.
3. Signs of Pulmonary Venous Hypertension (PVH)
The CXR is unique in its ability to show the hemodynamic consequences of cardiac disease on the lungs. When left-sided pressures rise (due to LV failure or mitral stenosis), that pressure is transmitted backward to the pulmonary veins and capillaries. This is Pulmonary Venous Hypertension.
The radiographic signs of PVH progress in predictable stages as the pulmonary capillary wedge pressure (PCWP) rises.
Radiographic approach to cardiac enlargement | PPTX
Let's return to our detailed slide deck to study the stages of pulmonary venous hypertension.
Please review the slides on 'Venous hypertension' (slides 73-76). Focus on the three distinct stages and the PCWP values associated with each.
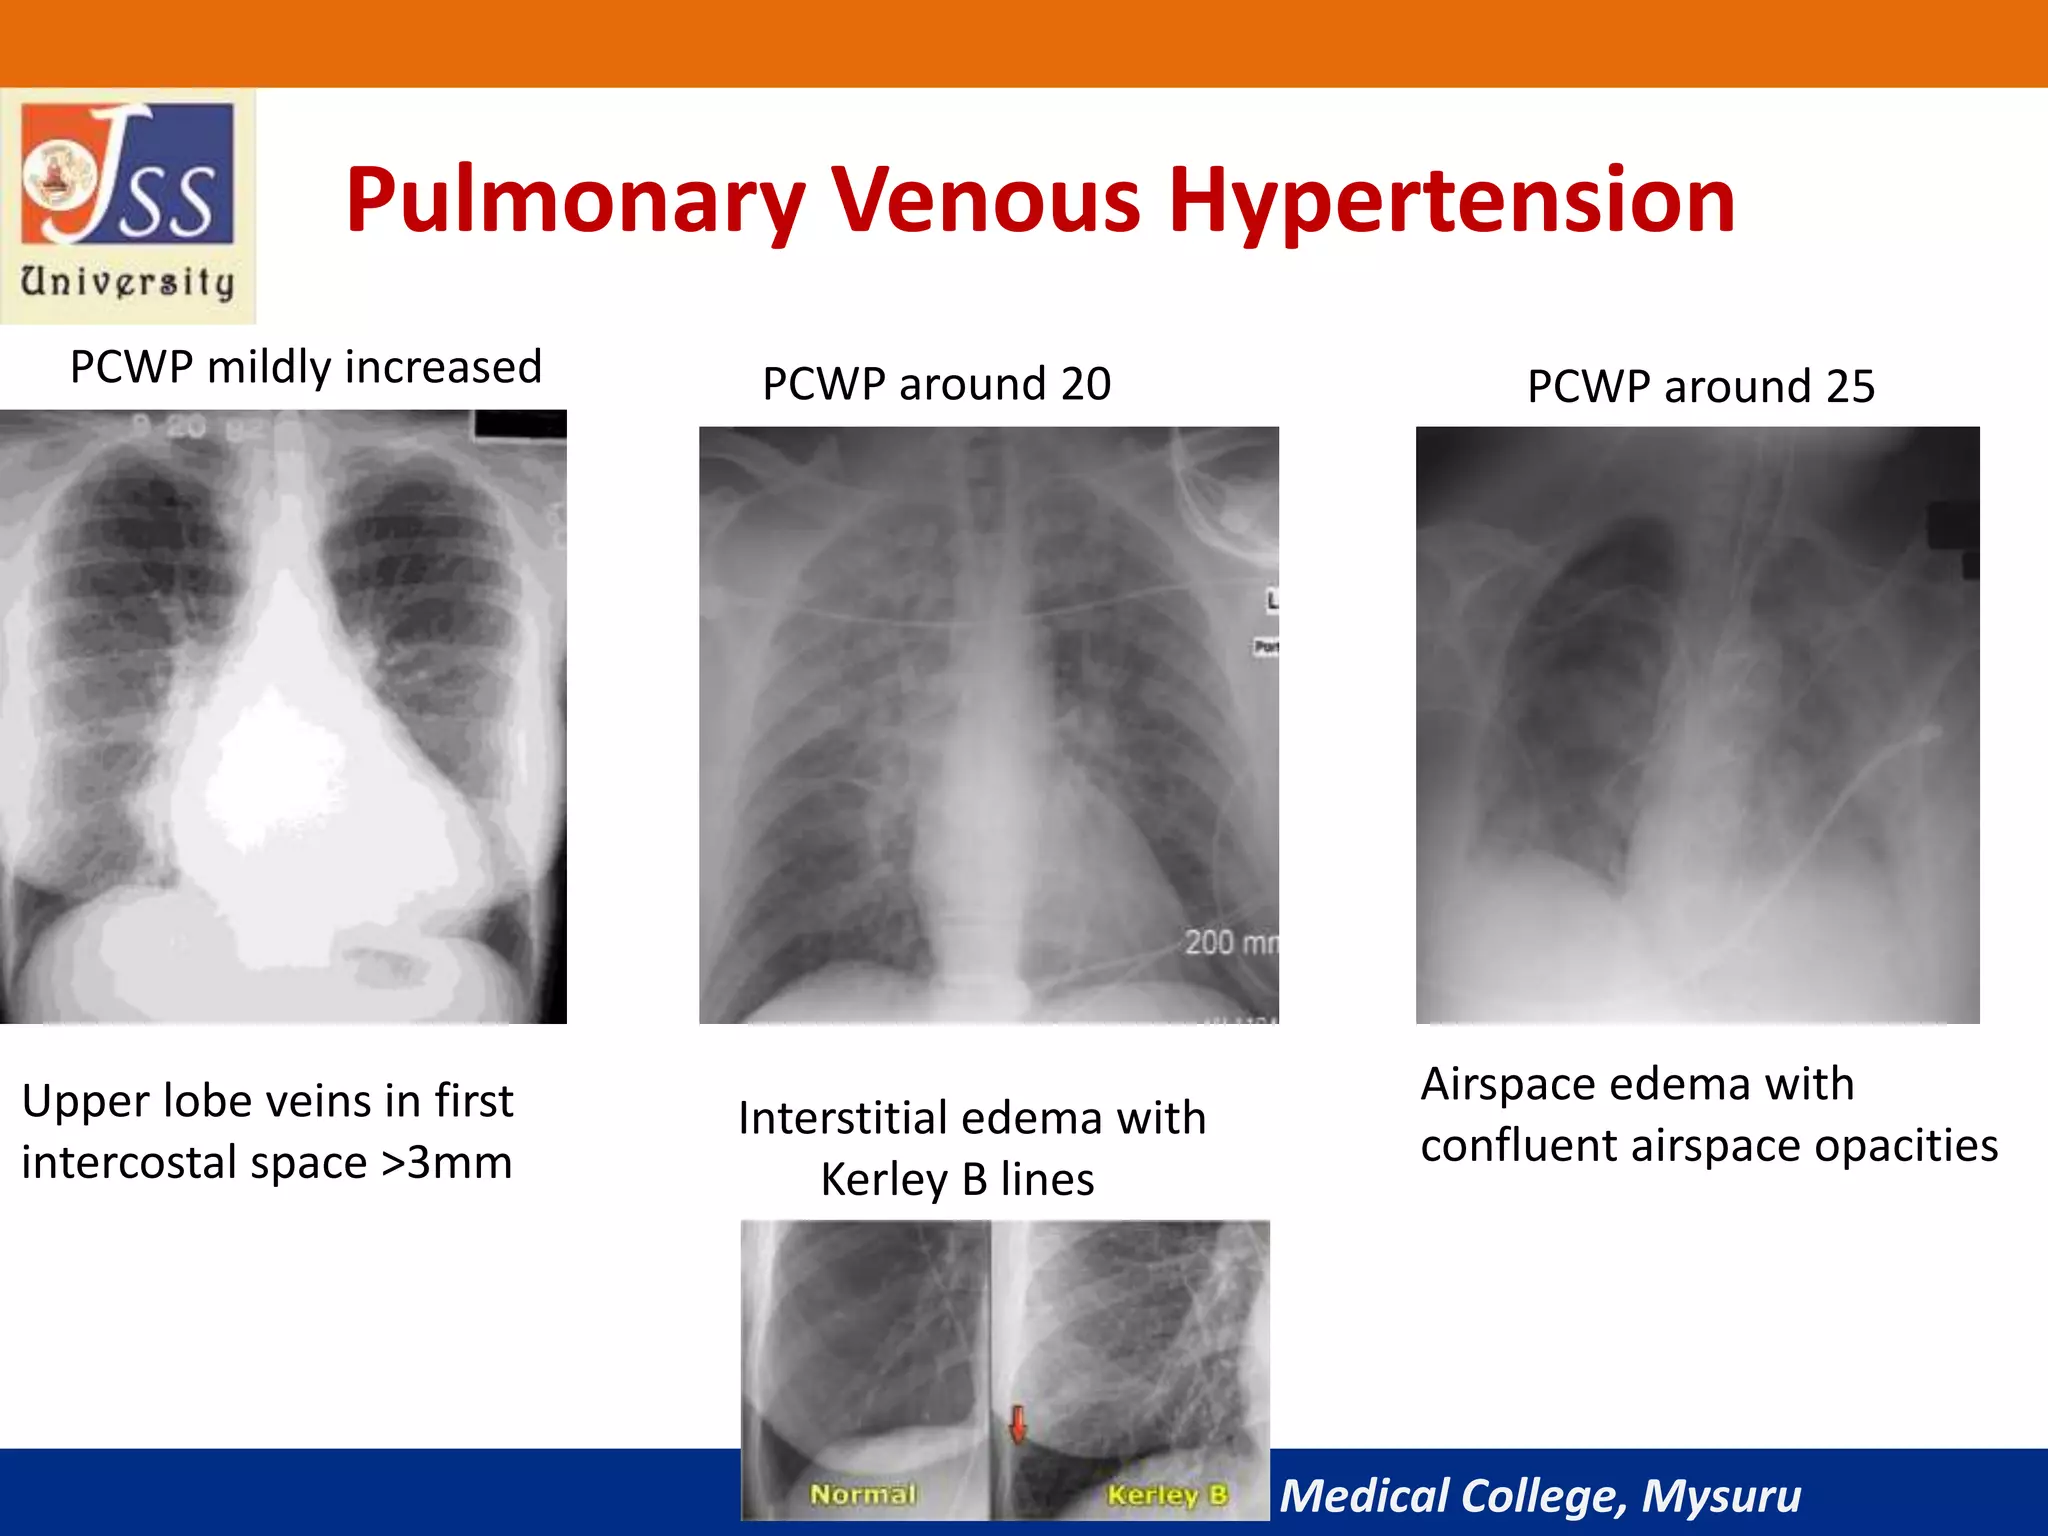
This image clearly demonstrates the three radiographic stages of pulmonary venous hypertension as the pulmonary capillary wedge pressure (PCWP) increases.
Here is a summary of the stages seen in the image and presentation:
-
Stage 1: Cephalization (PCWP 13-18 mmHg)
- Normally, due to gravity, blood flow is greater to the lung bases. The lower lobe vessels appear larger than the upper lobe vessels.
- In PVH, high pressure in the lower lobes causes vasoconstriction, shunting blood to the upper lobes.
- Radiographic Sign: The upper lobe vessels become equal in size or larger than the lower lobe vessels (vascular redistribution).
-
Stage 2: Interstitial Edema (PCWP 18-25 mmHg)
- As pressure continues to rise, fluid leaks from the capillaries into the lung interstitium.
- Radiographic Signs:
- Kerley B lines: Short (1-2 cm), thin, horizontal lines seen in the peripheries at the lung bases. They represent fluid in the interlobular septa.
- Peribronchial cuffing: Fluid thickens the bronchial walls, making them look like little doughnuts on end.
- Pleural effusions: Fluid collects in the pleural space, first causing blunting of the costophrenic angles.
-
Stage 3: Alveolar Edema (PCWP > 25 mmHg)
- Finally, fluid spills from the interstitium into the alveoli themselves.
- Radiographic Sign: Fluffy, bilateral, perihilar opacities, often described as a "bat-wing" or "butterfly" appearance. The peripheries of the lungs are relatively spared. This is the classic appearance of acute pulmonary edema.
Conclusion
Well done. Today, we've established a robust, systematic method for evaluating the heart and pulmonary vasculature on a chest X-ray. You've learned how to move from a general assessment of quality and size to identifying specific signs of chamber enlargement and the hemodynamic sequelae of heart failure.
Key Takeaways:
- System is Key: Always use a structured approach (RIPE for quality, ABCDE for review) to avoid errors. The PA film is the gold standard for cardiac assessment.
- Cardiothoracic Ratio (CTR): A CTR > 0.5 on a PA film is a useful, though not definitive, sign of cardiomegaly.
- Chamber Enlargement: Specific chambers alter the cardiac silhouette in predictable ways (e.g., LAE causes a double density sign and carinal splaying; RVE elevates the apex).
- Pulmonary Venous Hypertension: The CXR provides a window into left-sided heart pressures, with a clear progression from cephalization (Stage 1) to interstitial edema/Kerley B lines (Stage 2) to alveolar edema (Stage 3).
While the CXR provides crucial anatomical clues, it is ultimately a 2D shadow. It cannot tell us about ventricular function (like ejection fraction), visualize valve motion, or precisely quantify the severity of chamber enlargement. For that, we need a more dynamic and detailed imaging modality.
In our next lesson, we will move on to interpreting key findings from an echocardiography report, the gold standard for assessing cardiac structure and function. You will learn how echo directly confirms and quantifies the changes that the ECG and CXR can only suggest.