Hello! Welcome to your next lesson in the "Strategic Foresight & Failure Analysis" module.
In our last lesson, we focused on action, moving from identifying risks to proposing concrete mitigation strategies. We learned how frameworks like FMEA help prioritize risks and how good design can reduce the severity of failures. However, for deep, systemic problems, simply patching the symptoms isn't enough. To design truly robust systems, we must understand the underlying structure that causes the failure in the first place.
Today, we'll learn to map that underlying structure. We will focus on a particularly dangerous and common type of systemic failure: the collapse of trust. Your learning outcome for this lesson is to model a real-world product trust-collapse scenario using a causal loop diagram (CLD). This skill is the centerpiece of the Phase 1 Case Study and a cornerstone of advanced system architecture.
1. The Core Principle: Structure Generates Behavior
Before we build any diagrams, we need to internalize a fundamental concept from systems thinking. Often, when something goes wrong, our first instinct is to find someone or something to blame—a "bad" user, a "lazy" employee, a "flawed" algorithm. Systems thinking encourages us to look deeper.
The core idea is that the structure of a system generates its behavior. The choices people make are often rational responses to the system they are in. To change the behavior, you must change the structure.
This is a powerful mental shift for a designer. Instead of asking "Why did the user make that mistake?", you start asking, "What is it about the system's design that led the user down that path?"
The following video from an MIT course on System Dynamics provides an excellent introduction to this principle and the related concept of the "fundamental attribution error"—our tendency to blame people rather than the system.
System Dynamics: Systems Thinking and Modeling for a Complex World
This clip explains the foundational idea that the behavior we observe in the world is generated by underlying, often invisible, system structures. It makes a compelling case for why we must analyze the system, not just the actors within it.
Please watch from 18:07 to 22:52. Pay close attention to the distinction between events, patterns, and structure, and the explanation of the 'fundamental attribution error'.
This "Events, Patterns, Structure" pyramid is a key mental model. Reacting to events is firefighting. Adapting to patterns is better. But creating lasting change requires understanding and altering the structure. Causal loop diagrams are our tool for seeing that structure.
2. Anatomy of a Causal Loop Diagram (CLD)
A causal loop diagram is a visual language for telling the story of a system. It helps us map the interdependencies and feedback loops that are so difficult to describe with words alone.
To learn this language, we'll use a comprehensive guide that walks through the core components.
Systems Thinking Basics - From Concepts to Causal Loops
This guide, 'Systems Thinking Basics', provides a clear and detailed explanation of how to build and read CLDs. It will be our primary reference for this topic.
Please read Section 4, starting on page 51, up to the subsection 'Building a Causal Loop Diagram' on page 58. Focus on understanding these key building blocks: Variables and Links (arrows). Link Polarity: s (same) for relationships that move in the same direction, and o (opposite) for relationships that move in opposite directions. Reinforcing Loops (R): Engines of growth or collapse. They are vicious or virtuous cycles. Balancing Loops (B): Stabilizing, goal-seeking forces that resist change. Delays: Hidden troublemakers that can cause oscillations and unintended consequences.
To see these concepts brought to life, let's watch a short video that animates the construction of CLDs. This will help solidify the ideas you just read about.
Systems Thinking: Causal Loop Diagrams
This video, 'Systems Thinking: Causal Loop Diagrams,' offers a great visual walkthrough of the same concepts, using the classic example of population dynamics to illustrate how reinforcing and balancing loops interact.
Watch from the beginning to 06:40. This covers the fundamentals of variables, links, polarities, feedback loops (both R and B), and delays.
As you can see, a few simple rules allow us to map incredibly complex dynamics. A key skill is identifying whether a loop is reinforcing (R) or balancing (B). A quick way is to count the 'o' links: an even number (including zero) means the loop is reinforcing; an odd number means it's balancing.
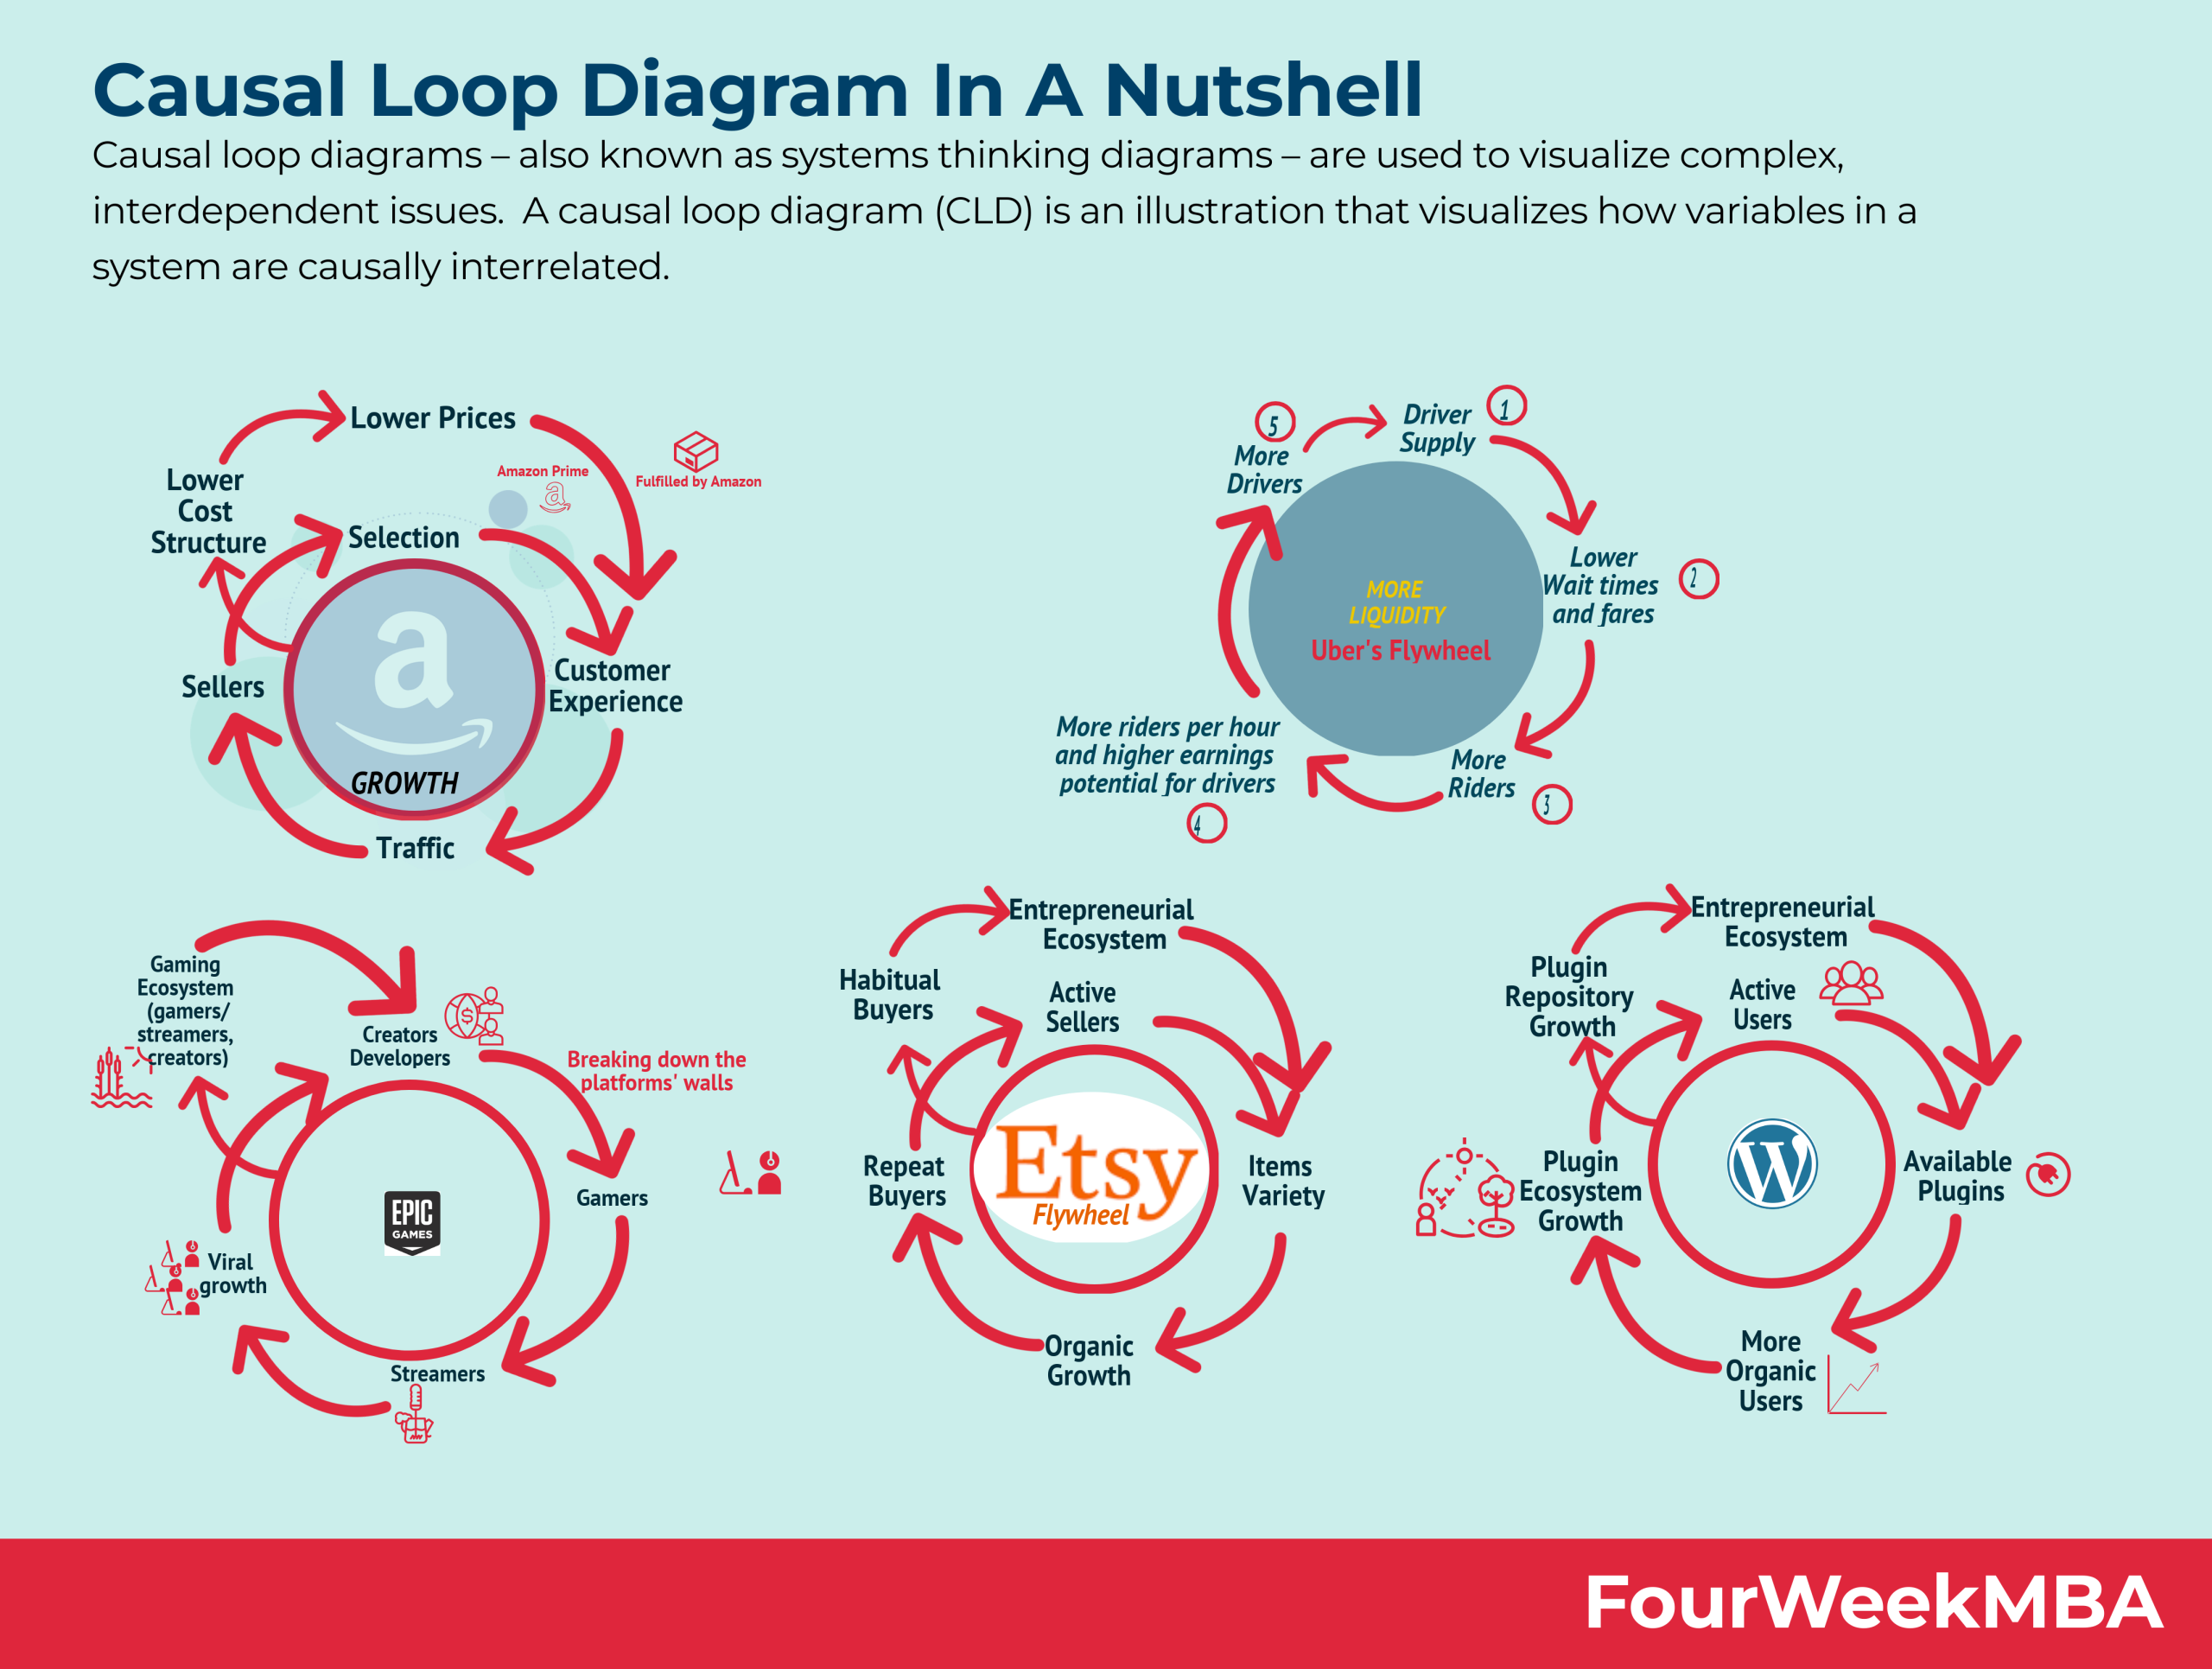
3. Modeling the "Distrust Doom Loop"
Now, let's apply this to our topic: trust collapse. A trust collapse is not a single event; it's a process driven by a vicious, reinforcing feedback loop. Social commentators have a name for this pattern: the "distrust doom loop."
Three systems thinking tools for exploring the Distrust ...
This article from Towards Data Science specifically discusses and models the 'distrust doom loop' using system archetypes and a CLD.
First, read the short section titled 'The distrust doom loop' to understand the concept. Then, jump to the section 'Wealth Disparity Loop & Distrust Doom Loop' and focus on the paragraph and diagram that model the distrust loop using three variables. This gives us a clear, simple archetype for what we are about to model in a more specific scenario.
A Worked Example: The Case of the Collapsing Banks
With the "distrust doom loop" archetype in mind, let's walk through a classic trust-collapse scenario. The same guide we used earlier contains a perfect case study that models a bank run—a rapid, systemic collapse of depositor trust.
The guide masterfully breaks down the process of turning a story into a CLD.
Systems Thinking Basics - From Concepts to Causal Loops
We will now return to the 'Systems Thinking Basics' guide to follow a step-by-step example of modeling a trust collapse.
Please read the subsection 'Building a Causal Loop Diagram,' starting on page 58 with the 'Case Study ® The Case of the Collapsing Banks' and continuing to page 61. Follow how the author: Formulates the problem. Identifies the key variables from the story: Depositors' confidence, Funds withdrawals, Bank solvency, and Bank failures. Builds the CLD link by link.
Let's analyze the final diagram from the case study:
This is the causal loop diagram modeling the bank collapse. An increase in Bank Failures leads to a decrease (o) in Depositors' Confidence. This leads to an increase (o) in Funds Withdrawals. This leads to a decrease (o) in Bank Solvency, which in turn leads to an increase (o) in Bank Failures, completing the loop.
Notice the story this diagram tells:
- As Bank Failures increase, Depositors' Confidence goes down (an
opposite relationship). - As Depositors' Confidence goes down, Funds Withdrawals go up (
opposite). - As Funds Withdrawals go up, Bank Solvency goes down (
opposite). - As Bank Solvency goes down, Bank Failures go up (
opposite).
This is a vicious cycle. Counting the links, we have four o's. An even number means this is a Reinforcing (R) loop. It reinforces the downward spiral, creating the "domino effect" described in the story. This is the engine of the trust collapse.
4. Your Turn: Modeling a Product Trust Collapse
Now, let's practice with a scenario closer to your work as a product designer.
Scenario: A leading social media platform, "ConnectSphere," rolls out a new AI-powered content moderation system. The goal is to reduce harmful content. However, within weeks, prominent users complain that their posts are being unfairly removed. A narrative emerges online that the AI is politically biased and acts like an overzealous censor. This sparks the hashtag #ConnectSphereIsOverParty.
Your task is to model this trust-collapse scenario.
-
Identify 4-5 key variables. Consider things like:
Perceived CensorshipUser Trust in PlatformNegative Media/Social BuzzUser Engagement/ActivityPressure on ConnectSphere to Act
-
Sketch a Causal Loop Diagram on paper or using a digital tool. Show how these variables influence each other. Start with
Perceived Censorshipand trace the causal chain. How does it eventually loop back to affect itself? -
Identify the loop type. Is the core loop driving the collapse reinforcing (R) or balancing (B)? Why?
Take about 10-15 minutes to sketch this out. This exercise is excellent preparation for our final lesson in this module.
Conclusion
Today, we've unlocked a powerful tool for understanding complex failures. Instead of getting stuck at the level of events ("users are complaining!"), we can now map the underlying structure that causes those events to happen.
Key Takeaways:
- Structure Generates Behavior: To solve chronic problems, you must understand and change the underlying system structure, not just blame the actors within it.
- Causal Loop Diagrams (CLDs) are the language we use to visualize a system's structure, showing variables, causal links, and feedback loops.
- Reinforcing (R) loops are the engines of exponential change. In a trust-collapse scenario, they manifest as vicious cycles where declining trust fuels actions that erode trust even further.
- By modeling a system, you can move from being reactive to being a proactive architect who can identify and intervene at high-leverage points.
Next Lesson Preview
In our final lesson of this module, we will synthesize what we've learned. The learning outcome is to analyze the key decisions in the trust-collapse scenario in terms of first and second-order consequences. Now that you can model the collapse with a CLD, we will use that model as a map to trace how specific decisions ripple through the system over time, connecting the tools of systems thinking with strategic foresight.