Hello! Welcome to the final lesson in our module on business analytics and experimentation.
In our last session, you learned how to interpret the core statistical outputs of an A/B test: p-values and confidence intervals. You can now confidently determine if a test result is statistically significant, separating a real effect from random noise.
However, a statistically significant result is only the first step. As a Business Analyst, your ultimate value lies in translating that data into a smart business decision. A 2% lift in conversions is statistically real, but is it worth the engineering cost to implement? What if it also increased customer support tickets?
This lesson will teach you how to recommend a business action based on the outcome of an experiment. We'll move beyond the statistics to incorporate business context, such as costs, risks, and strategic goals. This skill is crucial for making a real impact and is a common focus in BA job interviews, where you'll be asked to demonstrate not just analytical skills, but also business acumen.
1. Beyond Significance: The Business Context
Once you've confirmed statistical significance, you must ask the most important question: "So what?" Your stakeholders won't care about a p-value of 0.03; they want to know what to do. To answer that, you need to consider several business factors.
To start, let's watch a video that outlines the key factors to consider when making a launch decision.
A/B Testing in Data Science Interviews by a Google Data Scientist | DataInterview
This clip from the DataInterview channel, hosted by a Google Data Scientist, provides a concise framework for making a launch decision. It covers the crucial concepts of metric trade-offs, implementation costs, and the business risks of a false positive.
Watch the video from 16:03 to 19:27. Pay close attention to the three factors for a launch decision and the examples of how to interpret different results.
As the video explained, your decision hinges on three main areas:
- Practical Significance vs. Statistical Significance: A result can be statistically significant but practically meaningless. If a new ad campaign design produces a statistically significant 0.01% increase in revenue, but costs $50,000 to implement, it's a statistical win but a business failure. You must always ask: is the size of the effect large enough to justify the cost and effort?
- Metric Trade-offs: It's rare for an experiment to be a universal success. Often, your primary metric improves while a guardrail metric worsens. For instance, a more aggressive pop-up in an e-commerce app might increase checkouts (primary metric) but also increase app uninstalls (guardrail metric). Your job is to weigh these trade-offs and decide if the gain is worth the loss.
- Costs and Risks: Consider the full cost of a launch, including engineering effort, training, marketing, and ongoing maintenance. Also, consider the risk of a false positive (a Type I error). If you launch a change based on a fluke, you've wasted resources and potentially worsened the user experience.
2. The Decision Framework: Ship, Retest, or No-Ship?
Based on the statistical results and the business context, you can recommend one of three main actions. This is often called a "Ship, No-Ship, Retest" framework.
5 steps you wish you knew before running a product A/B test experiment
Product Manager Dianna Yau provides a clear, practical overview of this decision framework. She uses a great example from Airbnb to illustrate how teams make decisions based on conflicting metrics.
First, watch from 03:18 to 04:39 to understand the 'Ship, No-Ship, Retest' scenarios. Then, watch from 08:08 to 10:16, which explains how making the final decision is often an 'art' that requires team alignment and weighing trade-offs.
Here is a summary of the decision framework:
-
Ship / Launch: This is the recommendation when you have a clear winner.
- The result is statistically significant.
- The impact is practically significant (the lift is meaningful for the business).
- Guardrail metrics are not negatively affected in a major way.
- The benefits clearly outweigh the implementation costs.
-
Retest / Iterate: This is the right call when the results are promising but not conclusive, or when you have mixed results.
- Inconclusive results: The result is not statistically significant, but the confidence interval is very wide, suggesting the test lacked statistical power. The recommendation is to re-run the test for a longer duration or with more users.
- Mixed results: The primary metric improved, but a key guardrail metric worsened (e.g., higher conversion but also higher unsubscribe rate). The recommendation might be to iterate on the design to mitigate the negative impact and then test again.
- Promising but not practically significant: The lift is positive and statistically significant, but too small to justify a full launch. You might recommend further brainstorming to see if a more radical version of the idea could produce a bigger impact.
-
No-Ship / Scrap: This is the recommendation when the experiment clearly failed or the potential is too low.
- The result is statistically significant in a negative direction.
- The result is inconclusive after multiple tests, and the cost of further experimentation is high.
- The change produced no measurable effect, and the team agrees that there are higher-impact ideas to work on.
3. From Insights to Actionable Recommendations
Knowing the decision framework is good, but articulating a formal recommendation is a core BA skill. A crucial distinction here is between an insight and a recommendation.
- An Insight is a factual observation from the data.
- Example: "Exposing users to the new ad creative increased the Click-Through Rate by 15% with a p-value of 0.01."
- A Recommendation is a proposed course of action that leverages the insight to achieve a business goal.
- Example: "I recommend we roll out the new ad creative to all users. Based on the 15% CTR lift, we project an additional $200,000 in annual revenue, which provides a strong return on the estimated $10,000 implementation cost."
This next reading provides excellent examples of how to formulate compelling business recommendations from test results, especially relevant to your background in the media and ad space.
From Queries to Questions: Turning A/B Test Results into ...
The article 'From Queries to Questions' offers a practical guide on translating statistical outputs into business actions. It clearly distinguishes between insights and recommendations and provides concrete examples for a marketing A/B test.
Read the sections 'From Data to Insights' and 'From Insights to Action'. Focus on the definitions of practical significance, the clear difference between 'Insights' and 'Recommendations', and the specific examples of recommendations provided.
As the article highlights, a strong recommendation is specific, data-backed, and tied to a business outcome like revenue growth, cost savings, or efficiency gains.
4. Putting It All Together: A Case Study
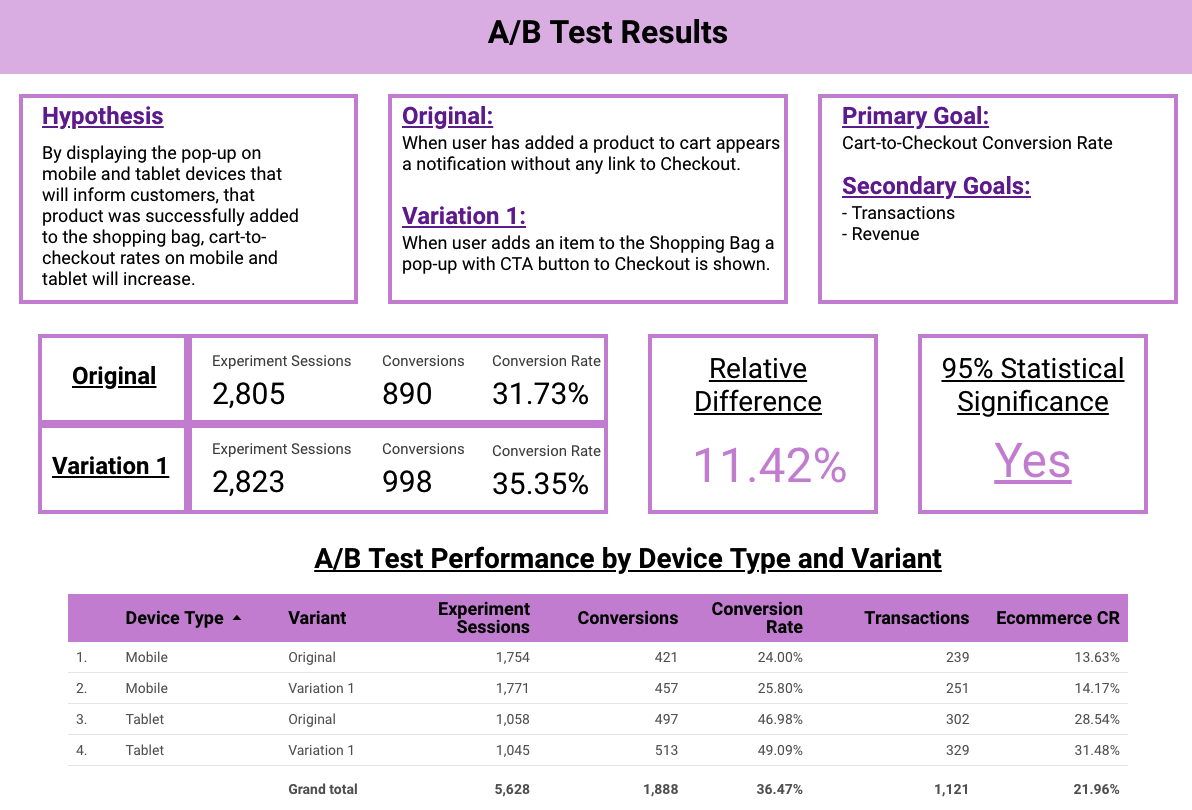
Let's apply these concepts to a realistic scenario. Imagine you ran an A/B test for an e-commerce client. The hypothesis was that adding a pop-up with a 'Go to Checkout' button after a user adds an item to their cart would increase the cart-to-checkout conversion rate.
Here are the results from your testing tool:
Test your understanding!
Scenario:
The dashboard above shows a clear statistical win. The Head of Product is excited and says, "This is great! Let's ship it immediately."
Before you agree, you do your due diligence as a BA:
- You speak to the lead engineer, who estimates implementing this pop-up reliably across all devices and browsers will take a full engineering sprint (2 weeks) for two developers.
- You check your diagnostic metrics and notice a small (but statistically insignificant) increase in the number of users who abandon their session shortly after the pop-up appears.
Task:
How do you respond to the Head of Product? What is your final recommendation? Formulate it as you would in a meeting.
Show answer
Here is a possible response that demonstrates strong BA skills:
"I agree that the 11% lift in our primary metric is a fantastic result and proves our hypothesis was correct. It's a clear statistical win.
However, before we commit to a full, immediate rollout, I have two points for us to consider:
- Implementation Cost: The engineering estimate is 80 hours of developer time. While the revenue lift will likely provide a positive ROI, we need to ensure this is the best use of our development resources for the next sprint compared to other priorities.
- Potential User Annoyance: We saw a slight, though not statistically significant, increase in users leaving after seeing the pop-up. This could be a leading indicator of user annoyance that might impact long-term retention, which we didn't measure.
My Recommendation:
Instead of a 100% launch, I recommend a phased rollout. Let's ship this feature to 25% of our users immediately. This will allow us to start realizing the conversion gains while we do two things in parallel:
- Monitor the long-term retention and engagement of that 25% cohort over the next month to ensure we aren't harming user loyalty.
- Queue the full rollout for a future sprint, which we can cancel if we see any negative long-term effects.
This approach allows us to act on our positive result while mitigating the risks."
This answer shows that you're not just a data reporter. You're thinking about costs, risks, and long-term strategy, and you're proposing a specific, actionable plan that balances opportunity and risk.
5. Communicating Your Recommendation
Your final step is to formally present your findings and recommendation to stakeholders. Your analysis is only as good as your ability to communicate it.
The structure of your presentation should be logical and tailored to your audience.
From Queries to Questions: Turning A/B Test Results into ...
Let's return to the article 'From Queries to Questions' and look at its advice on structuring your presentation. This is highly relevant to your goal of preparing formal IT documentation and stakeholder presentations.
Read the section 'Craft your presentation'. Focus on the four main sections of a presentation and the questions you should ask yourself to tailor your content to the audience.
Remember to adapt your message:
- For Executives: Lead with the Executive Summary. Focus on the key takeaways and the bottom-line impact (ROI, revenue, cost savings).
- For Marketing/Product Teams: Focus on the Insights and how they inform user behavior and strategy.
- For Technical Teams: Be prepared to go into the Methodology and discuss the data in more detail.
Conclusion
Congratulations on completing this module! You have now progressed from defining a business problem and metrics, to understanding the statistics of testing, and finally to making a data-driven business recommendation.
Key Takeaways:
- A business recommendation goes beyond statistical significance to include practical significance, metric trade-offs, and cost-benefit analysis.
- Use a clear decision framework: Ship, Retest, or No-Ship.
- Distinguish between insights (what the data says) and recommendations (what the business should do).
- A strong recommendation is specific, actionable, and considers both opportunities and risks. A phased rollout can be an excellent way to balance them.
- Always tailor your communication to your audience, focusing on the metrics and outcomes they care about most.
Preview of the Next Lesson:
You've built up an impressive toolkit of individual business analysis skills. Now it's time to put them all together. In our next module, the Capstone, you will tackle realistic, end-to-end case studies that mimic the challenges you'll face in a BA role and in job interviews. We will begin by having you solve a requirements-focused case study, taking it from initial elicitation all the way to documentation.