Hello! Welcome to your next lesson on business analytics and experimentation.
In our last session, you learned how to formulate a clear, testable hypothesis for an A/B test. We used the "If... Then... Because..." framework to turn a business problem into a concrete prediction. For example: If we make a change, then we expect a certain outcome, because of an underlying reason based on our analysis.
Today, we're going to focus on the "then" part of that statement. How do you actually measure that outcome? A successful experiment isn't just about seeing if "things got better"; it's about precisely quantifying success and understanding the full impact of a change.
This lesson will teach you how to define primary and secondary metrics for evaluating an A/B test. As a Business Analyst, selecting the right metrics is one of your most critical responsibilities in the testing process. It ensures your experiments are aligned with business goals and that you can confidently recommend a course of action to stakeholders based on the results.
1. The Primary Metric: Your North Star
Every A/B test needs a single, clear measure of success. This is known as the primary metric, sometimes called a "North Star metric" or an "Overall Evaluation Criterion (OEC)". Its purpose is to provide an unambiguous answer to the question: "Did the test succeed?"
To ensure focus and prevent "cherry-picking" positive but irrelevant results after the fact, you must choose only one primary metric before the experiment begins.
A/B Tests Marketing Can Trust: Structure, Decisions, and ...
This article, 'A/B Tests Marketing Can Trust', does an excellent job explaining the importance of choosing a single primary metric and how it should align directly with your goal. It also introduces the concept of guardrail metrics, which we'll cover next.
Please read the sections '3. One Primary Metric to Decide' and 'Metrics: Driven by the Hypothesis'. Focus on why it's crucial to select only one primary metric and how that metric should be a direct consequence of your hypothesis.
As the article highlights, your primary metric should directly measure the outcome you predicted in your hypothesis.
Let's revisit the AdTech scenario from our last lesson:
- Problem: A valuable "Automated Bidding" feature has low adoption because it's hidden in a menu.
- Hypothesis: If we add a prompt on the main dashboard to set up "Automated Bidding," then the adoption rate of this feature will increase.
- Primary Metric: The primary metric here is clear and directly linked to the hypothesis: Adoption rate of the Automated Bidding feature, measured as (Number of new users enabling the feature) / (Total number of new users).
2. Secondary Metrics: The Full Story
While the primary metric determines the winner, it doesn't tell the whole story. A change can have ripple effects—both good and bad—across the user experience. This is where secondary metrics come in. They provide context, act as safety nets, and help you understand the why behind your results.
Secondary metrics generally fall into two categories:
- Guardrail Metrics: To ensure you're not causing harm.
- Diagnostic Metrics: To understand user behavior and explain why the primary metric changed.
The image below provides an excellent framework for how these metrics fit together. The "North Star Metric" is your primary metric.

3. Guardrail Metrics: Do No Harm
A guardrail metric is a "do no harm" metric. Its purpose is to catch unintended negative consequences of your change. You don't expect it to improve, but you need to monitor it to ensure it doesn't get significantly worse.
For example, making a "buy now" button larger and brighter might increase your primary metric (conversion rate), but it could also annoy users and increase your app uninstall rate (a guardrail metric).
A/B Testing Metrics: What You Need to Know About Success, Driver, and Guardrail Metrics!
The following video provides clear definitions for different types of A/B testing metrics, including a great explanation of guardrail metrics. The speaker uses a framework of goal, driver, and guardrail metrics, which maps closely to our discussion.
Please watch from 01:14 to 06:48. Pay attention to: Goal/Success Metrics (01:14): These are often the high-level business goals that your primary metric contributes to. Driver Metrics (02:37): These are more sensitive and are often chosen as the primary metric for an experiment. Guardrail Metrics (04:42): Focus on this section, which explains their role in protecting the business from harm.
A common decision-making rule in business analysis is: A change will be implemented only if it shows a statistically significant improvement in the primary metric AND causes no significant harm to any guardrail metrics.
4. Diagnostic Metrics: Understanding the "Why"
While guardrail metrics look for negative side effects, diagnostic metrics (often just called secondary metrics) help you understand the user behavior that led to the change in your primary metric. They help you build a narrative around your results.
Let's look at the framework image again.
- Hypothesis: Adding an "add-to-basket" CTA will increase orders.
- Primary Metric: Orders / Order Conversion Rate.
- Diagnostic Metrics: "Item added to baskets," "Item removed from basket," "Funnel steps."
If your primary metric (orders) goes up, you would check the diagnostic metric ("Item added to baskets") to confirm it also went up. This validates your reasoning. If orders didn't go up but "Item added to baskets" did, it tells you the new CTA is working, but there might be a new problem later in the checkout funnel to investigate.
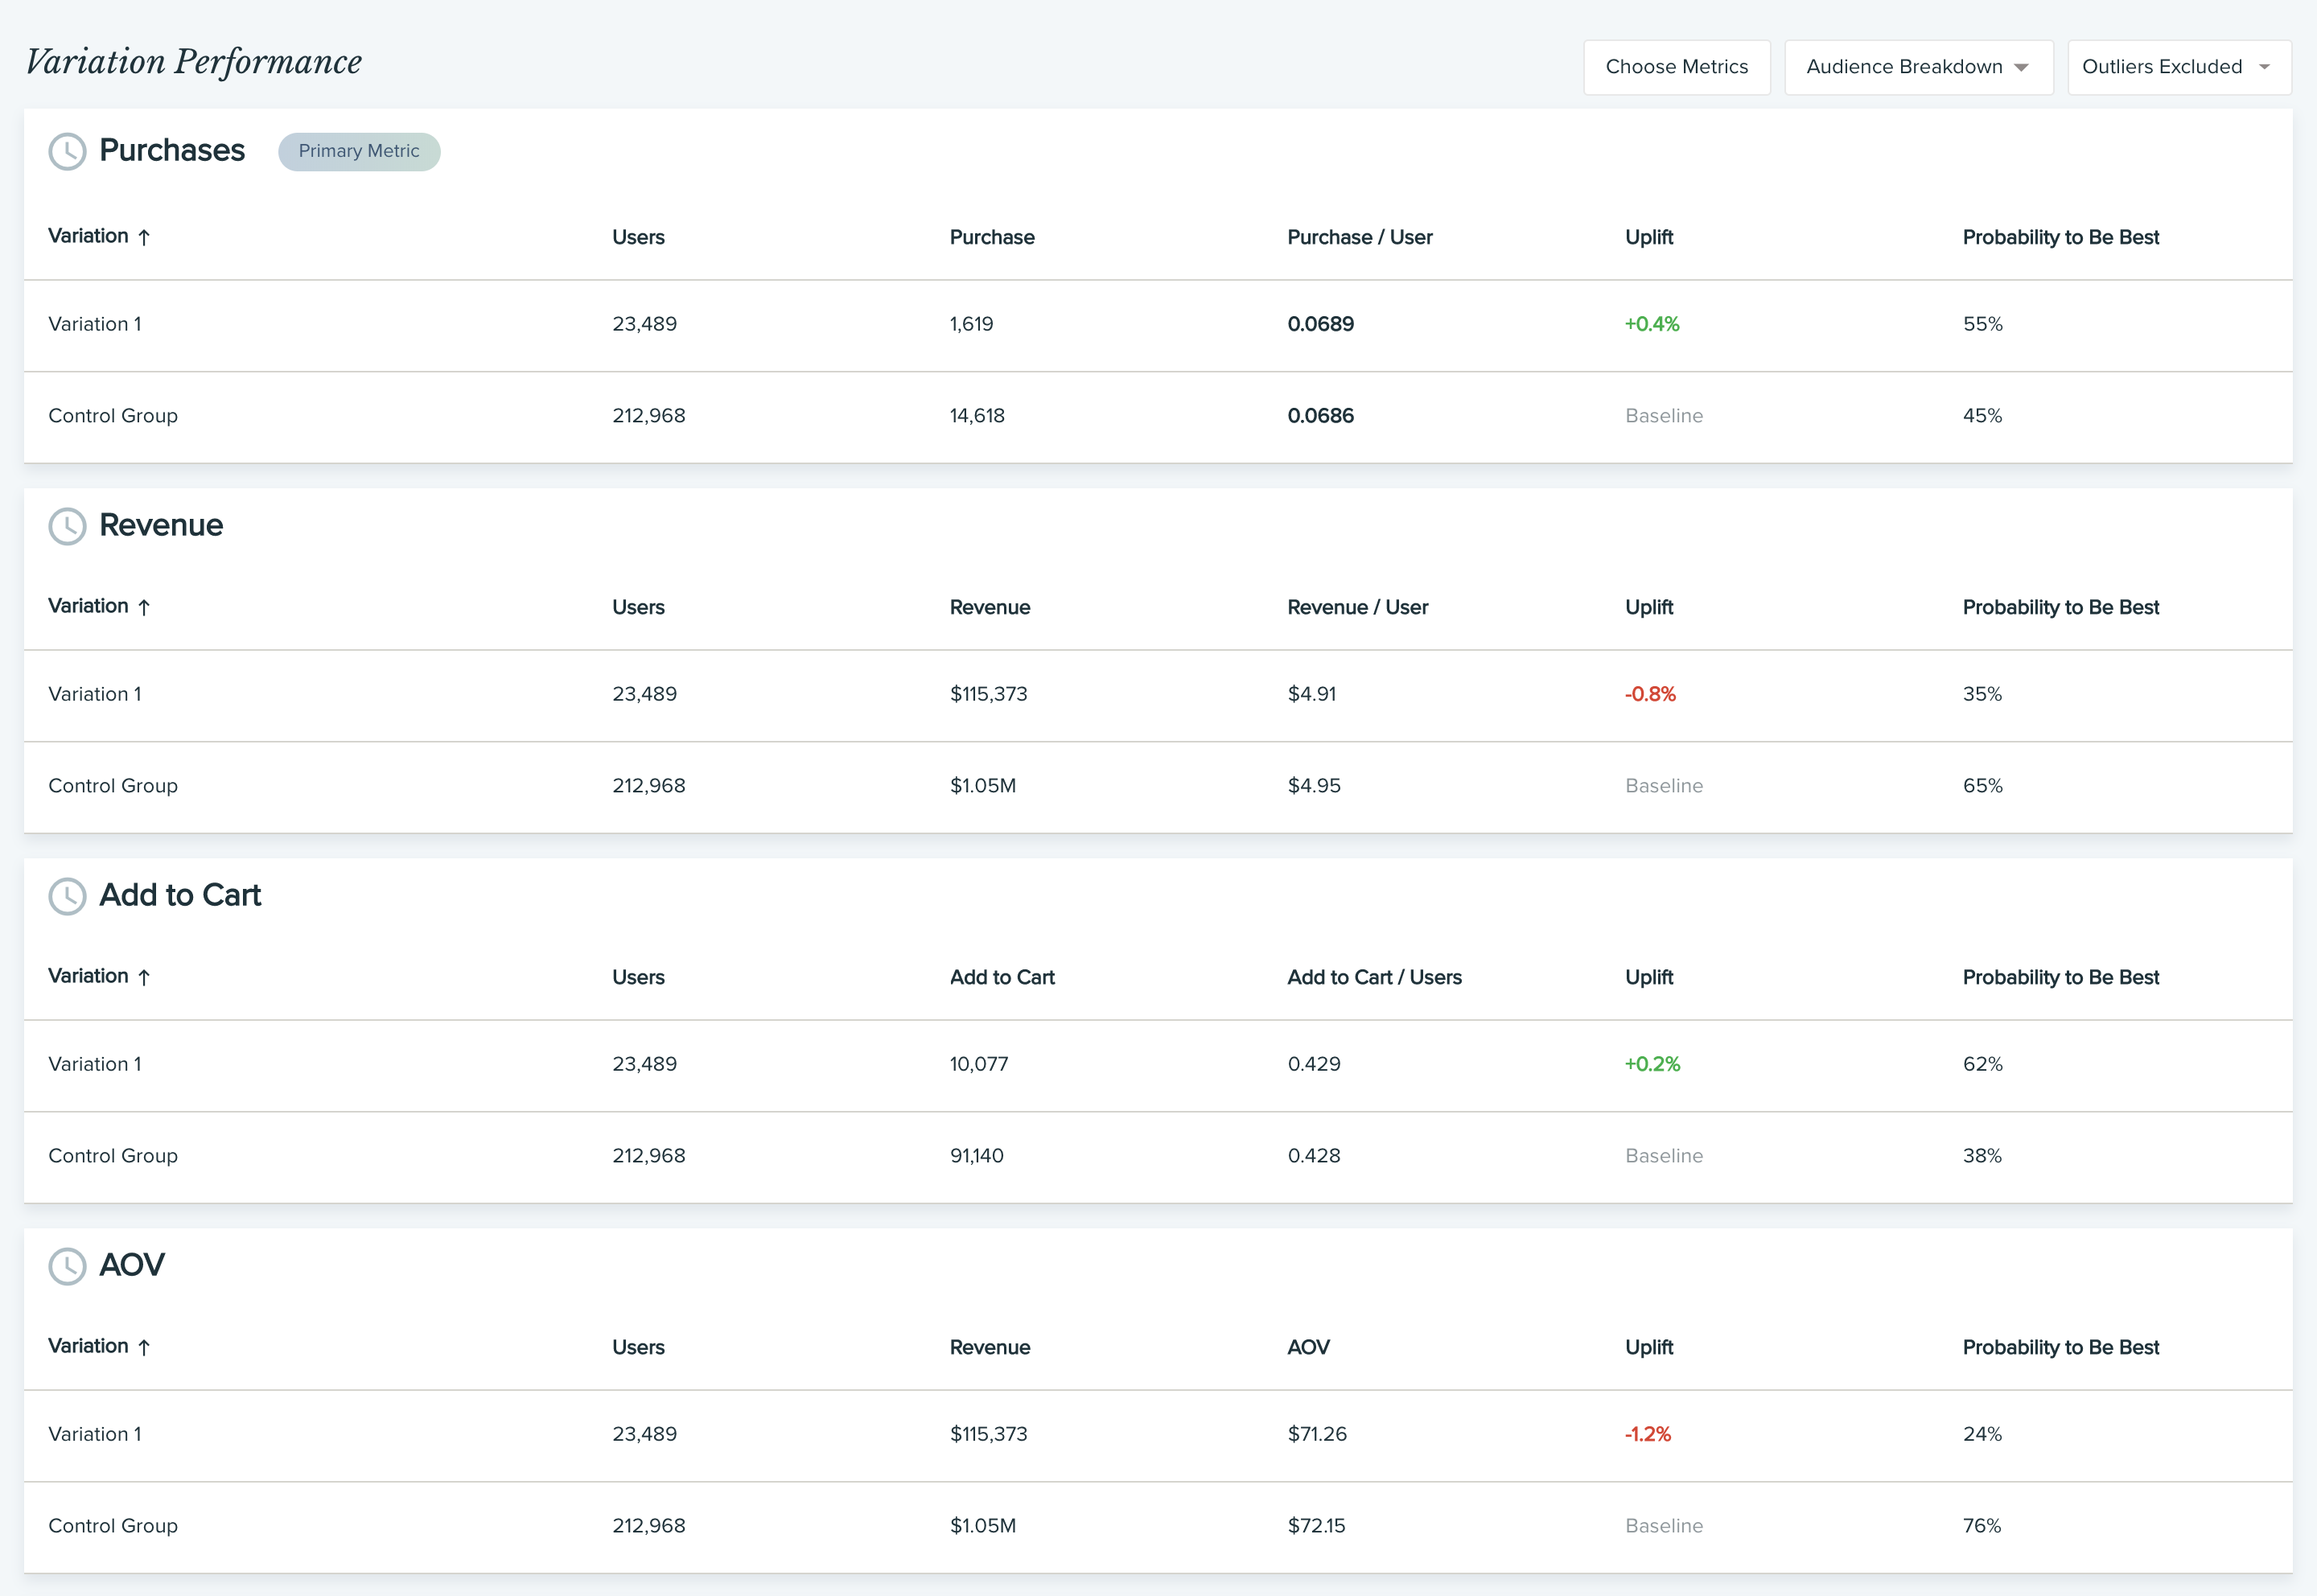
The report below shows how these metrics are typically presented. "Purchases" is the primary metric, while Revenue, Add to Cart, and AOV are secondary metrics that help diagnose the overall impact.
Given your background and interest in AdTech, it's useful to see what kinds of metrics are common in that domain.
Creative testing: Strategies for high-impact ad campaigns
This article from AppsFlyer, a major player in the AdTech space, lists several key metrics used for testing ad campaigns. These can serve as either primary, guardrail, or diagnostic metrics depending on your test's hypothesis.
Please read the section 'Creative testing metrics'. Notice metrics like Click-Through Rate (CTR), Cost Per Acquisition (CPA), and Return On Ad Spend (ROAS). Think about how each of these could be used as a primary or guardrail metric in different scenarios.
5. Putting It All Together
Now it's your turn. Let's apply this framework to a new scenario.
Test your understanding!
Scenario: You are a BA for a mobile game that monetizes through interstitial video ads. The current setup shows a "Skip Ad" button after 5 seconds. The team believes this is frustrating users.
Hypothesis: If we show the "Skip Ad" button 2 seconds earlier (at the 3-second mark), then the average number of ads viewed per user will increase, because users will be less frustrated, leading to longer play sessions and more opportunities to show ads.
Task: For this A/B test, define:
- The single Primary Metric.
- At least two important Guardrail Metrics.
- At least one useful Diagnostic Metric.
Show answer
Here is a well-structured set of metrics for this test. Your answer may vary slightly, but the logic should be similar.
-
Primary Metric: Average ads viewed per user session. This metric directly measures the main outcome stated in the hypothesis ("the average number of ads viewed per user will increase").
-
Guardrail Metrics:
- Revenue per user (or ARPU): This is critical. Shorter ad views might lead to lower payouts from advertisers, so even if users see more ads, overall revenue could drop. We need to ensure we don't harm the bottom line.
- Day-1 User Retention Rate: If the new ad experience is still perceived as poor, it could hurt user retention. This is a key business health metric to protect.
- Average Session Length: The hypothesis assumes this will increase, but we should monitor it as a guardrail. If session length decreases, our core assumption is wrong.
-
Diagnostic Metric:
- Ad skip rate: This helps validate our thinking. Did users actually skip the ads more frequently when given the chance? This helps explain why session length might have changed.
Conclusion
You now have a robust framework for measuring the success of an A/B test, moving beyond a single success metric to a holistic view of an experiment's impact. This structured approach is essential for making sound business decisions and for communicating your findings clearly to stakeholders.
Key Takeaways:
- The Primary Metric is the single, pre-defined measure of success that determines if a test is a "win" or "loss." It must directly align with your hypothesis.
- Secondary Metrics provide crucial context. They are divided into:
- Guardrail Metrics, which act as safety nets to monitor for unintended negative consequences (e.g., revenue loss, increased unsubscribes).
- Diagnostic Metrics, which help you understand why your primary metric changed by shedding light on user behavior (e.g., click-through rates on a specific element).
- Defining your metrics before the test runs is a critical part of a Business Analyst's role in maintaining experimental rigor.
Preview of the Next Lesson:
You've formulated a hypothesis and defined the metrics to measure it. The next logical step is running the experiment and analyzing the data. In our next lesson, we will focus on how to interpret the statistical results of an A/B test, including concepts like p-values and confidence intervals, to decide with confidence whether to launch your change.