Hello! Welcome to the final lesson in our module on business analytics and experimentation.
In our last lesson, you learned how to take the statistical results of an experiment and formulate a sound business recommendation. This involved looking beyond p-values to consider practical significance, costs, risks, and strategic trade-offs.
Today, we'll put all the pieces from this module together. Your learning goal is to analyze a case study involving a business problem in the AdTech domain. This is a perfect opportunity to connect the theory of experimentation with your professional background in media and advertising. We will tackle a realistic scenario, applying a formal analytical structure to move from a vague business problem to a clear, data-driven recommendation. Mastering this skill is critical for both real-world BA work and for succeeding in case study-based job interviews.
1. The AdTech Landscape: A Quick Refresher
Before we dive into the case, let's quickly align on the core concepts of the programmatic advertising world. Given your experience, these ideas will be familiar, but a brief review will help set the stage for our problem.
Programmatic advertising is the automated buying and selling of digital ad space. At its heart is a process called Real-Time Bidding (RTB).
To visualize this ecosystem, let's start with a short video.
How Does Real-Time Bidding Work? | Explained in Under 5 Minutes
This video from WebFX, titled 'How Does Real-Time Bidding Work?', provides a concise, under-3-minute overview of RTB, explaining the roles of Demand-Side Platforms (DSPs), Supply-Side Platforms (SSPs), and Ad Exchanges.
Watch the video from the beginning to 02:58. Focus on understanding the function of each platform (DSP, SSP, Ad Exchange) and the sequence of events that occurs in the milliseconds it takes for a webpage to load.
The process described in the video can be summarized in the following diagram:
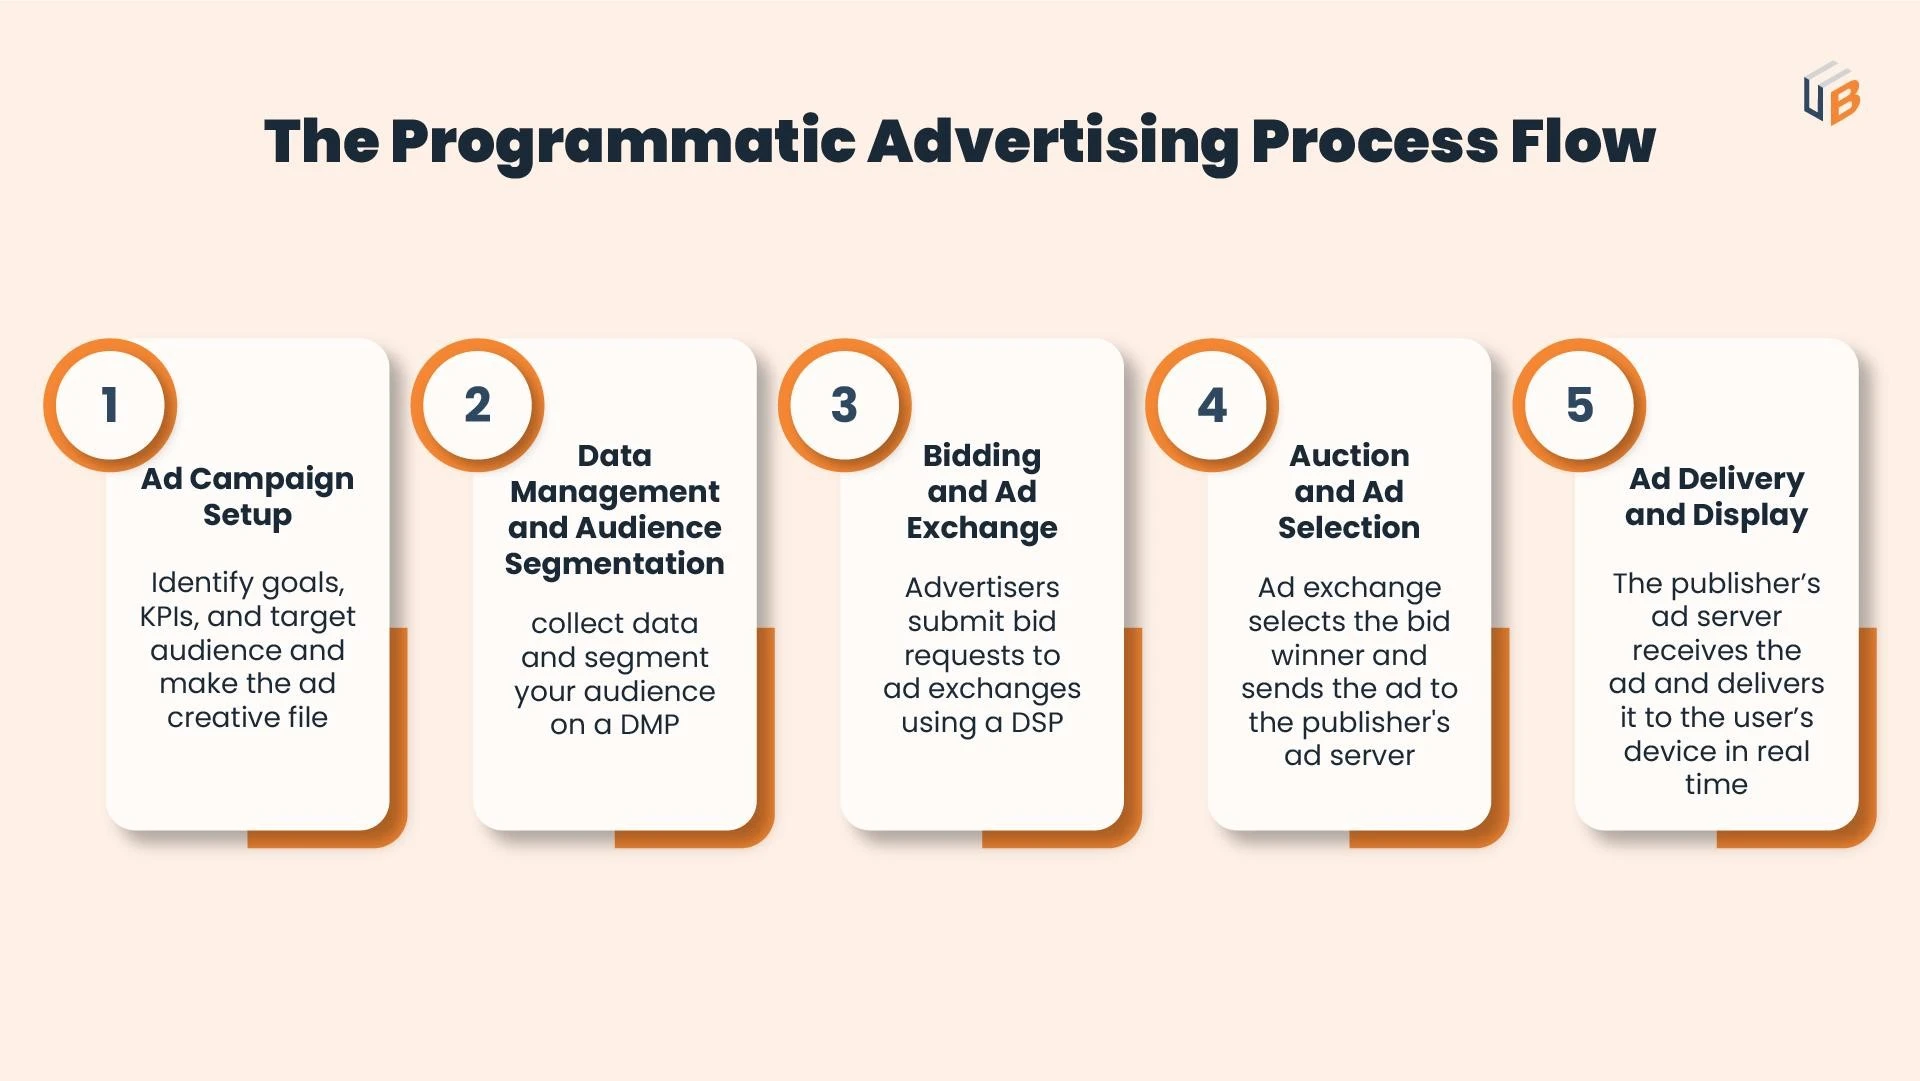
In this lesson, our case study will focus on the Demand-Side Platform (DSP), the platform used by advertisers to manage their ad buys and bid on inventory.
2. The Case: Optimizing a DSP's Bidding Algorithm
Here is the business problem we will analyze today:
You are a Business Analyst at "BidWise," a popular Demand-Side Platform (DSP). Your clients are advertisers who want to show their ads to the right users at the right price.
The engineering team has developed a new, experimental bidding algorithm. The current algorithm primarily bids based on historical conversion rates for similar ad placements. The new algorithm uses machine learning to also predict the likelihood a user will engage with the ad, hoping to win more effective ad placements.
Leadership wants to know if they should roll out this new algorithm to all clients. They've tasked you with designing a test and providing a recommendation.
3. A Framework for Analysis
Tackling a business case like this requires a structured approach. A vague or disorganized analysis won't impress stakeholders or interviewers. We will use a professional decision-making framework to guide our work.
Decision-making Question: Netflix Ad-Supported Tier Decision
The article 'Decision-making Question: Netflix Ad-Supported Tier Decision' outlines an excellent five-step framework for solving strategic business problems. While the case is about Netflix, the structure is universally applicable and highly valued in top companies.
Read the section titled 'Approach to Solving Decision-Making Questions'. Focus on understanding the five steps: Clarify Context, Define Goals, Generate Options, Evaluate Systematically, and Recommend.
Let's apply this framework to our BidWise case.
Step 1: Clarify the Context
First, we need to ensure we fully understand the problem and constraints. In an interview, you'd ask clarifying questions. Here, we'll state our assumptions:
- Problem: The core business driver is the need to improve the performance of the DSP's bidding algorithm to deliver better results for clients, which in turn increases client retention and platform revenue.
- Business Goal: Increase the value delivered to clients without making the platform prohibitively expensive.
- Constraint: The solution should not significantly hurt key client performance metrics. A client whose costs skyrocket will leave the platform, even if the DSP's metrics look good.
Step 2: Define Goals and Success Criteria
This is where we define what "better" means by setting clear metrics. This is arguably the most critical step for a BA. For this case, we need to balance the DSP's goals with its clients' goals.
-
Primary Metric: This is the main metric we expect the new algorithm to improve.
- Win Rate: The percentage of auctions won out of the total number of bids submitted. A higher win rate means our clients' ads are being shown more often.
-
Guardrail Metrics: These are metrics we must monitor to ensure we're not causing unintended harm. Improving the primary metric at the expense of these could make the whole change a failure.
- Cost Per Acquisition (CPA): This is a key client-facing metric. It's the total cost of a campaign divided by the number of conversions (e.g., sales, sign-ups). If our new algorithm wins more auctions but does so by bidding on extremely expensive inventory, the client's CPA might increase, making them unhappy.
- Click-Through Rate (CTR): The number of clicks an ad receives divided by the number of times it's shown (impressions). The new algorithm claims to predict engagement. A higher CTR would help validate this claim.
- Cost Per Mille (CPM): The cost for 1,000 ad impressions. We must track this to understand the cost implications for the DSP and its clients.

Step 3: Design the Experiment
Now, we'll design an A/B test to compare the new algorithm (variant) against the current one (control).
-
Hypothesis:
- Null Hypothesis (): The new bidding algorithm has no statistically significant effect on the Win Rate compared to the current algorithm.
- Alternative Hypothesis (): The new bidding algorithm results in a statistically significant increase in the Win Rate.
-
Experiment Setup:
- Randomization Unit: We need to decide what to split into control and variant groups. We'll choose the campaign level. We will randomly assign entire advertising campaigns to either the control group (using the old algorithm) or the variant group (using the new one). This avoids having the same advertiser's campaigns in both groups, which could muddy the results.
- Duration: We should run the test for at least two full weeks to capture any day-of-the-week effects on user behavior and ad prices. A four-week test would be even more robust.
- Data Collection: For the duration of the test, we will log the Win Rate, CPA, CTR, and CPM for all campaigns in both the control and variant groups.
Step 4 & 5: Evaluate Systematically & Recommend
After running the experiment, we'll get the results. As a BA, your job is to interpret these results and recommend a course of action. This is where you apply the "Ship, Retest, or No-Ship" framework.
Test your understanding!
For each of the three scenarios below, decide on a recommendation (Ship, Retest/Iterate, or No-Ship) and briefly explain your reasoning. Think about the trade-offs between the primary metric and the guardrail metrics.
Scenario 1:
- Win Rate: +12% (Statistically significant, p < 0.05)
- CPA: -2% (Not statistically significant)
- CTR: +5% (Statistically significant, p < 0.05)
What is your recommendation and why?
Show answer
Recommendation: Ship (Launch)
Reasoning: This is a clear win. The new algorithm significantly improved the primary metric (Win Rate) and a key guardrail metric (CTR), validating its claim of predicting engagement. Most importantly, it did so without negatively impacting the client's cost per acquisition (CPA). The business goal has been achieved with no significant downside.
Test your understanding!
Scenario 2:
- Win Rate: +20% (Statistically significant, p < 0.05)
- CPA: +18% (Statistically significant, p < 0.05)
- CTR: +3% (Not statistically significant)
What is your recommendation and why?
Show answer
Recommendation: Retest / Iterate
Reasoning: This result presents a difficult trade-off. While the Win Rate is up dramatically, the cost for clients (CPA) has also risen significantly. This creates a conflict: BidWise wins more auctions, but its clients are paying much more per conversion, which could lead to churn.
The recommendation should be to not ship this version. Instead, the BA should work with the engineering team to iterate. The goal would be to tweak the algorithm to be less aggressive on price. Can we adjust the machine learning model's parameters to find a better balance between winning auctions and controlling costs? A follow-up experiment would be required to test the next iteration.
Test your understanding!
Scenario 3:
- Win Rate: +1.5% (Not statistically significant, p = 0.25)
- CPA: No significant change
- CTR: No significant change
What is your recommendation and why?
Show answer
Recommendation: No-Ship (for now)
Reasoning: The experiment failed to show a statistically significant improvement in the primary metric. The new algorithm, in its current form, does not appear to be better than the old one. This could be because the true effect is very small, or the test lacked statistical power.
The immediate recommendation is No-Ship. However, a good BA would also suggest a next step: conduct a power analysis to see if the experiment was simply too small to detect a meaningful effect. If the potential upside is high, you might advocate for re-running the test with a larger sample size. If the potential upside is low, the recommendation would be to scrap this idea and have the team focus on other, more promising initiatives.
Conclusion
Congratulations on completing this lesson and the entire module! You've successfully navigated a complex, domain-specific case study from start to finish.
Key Takeaways:
- Structure is Key: A formal framework (Clarify -> Define Goals -> Design -> Evaluate -> Recommend) is essential for analyzing business problems and is highly valued in interviews.
- Metrics Define Success: The most critical BA task in an analytical project is defining the primary and guardrail metrics. This step aligns the technical solution with the business goals.
- AdTech is About Trade-offs: Business problems in AdTech often involve balancing competing incentives, such as increasing volume (Win Rate) while controlling costs (CPA).
- The Recommendation is the Goal: Your final output isn't just data; it's a clear, actionable recommendation that considers statistical results, business context, and potential risks.
Preview of the Next Lesson:
This lesson concludes our module on "Business Analytics and Experimentation." You have built a strong foundation in framing problems, defining metrics, and using data to drive decisions.
You are now ready for the Capstone. In the next module, we will move into full, end-to-end case studies that simulate the challenges you'll face in a BA interview and on the job. We'll begin by having you solve a requirements-focused case study, from elicitation to documentation. This will be an excellent opportunity to practice another core BA competency.