Introduction
Welcome to the start of a new module. In the previous lessons, we established a robust workflow for managing your R projects using Git and GitHub. Now, we will shift our focus from project management back to the core of your goal: statistical analysis. You expressed a desire for a "solid foundation" in theory before building up to advanced applications, and this lesson begins that foundational work.
Today, we will explore the fundamental logic of statistical inference. Specifically, this lesson addresses how to translate a research question into a testable framework. You will learn the core concepts of hypothesis testing, including the roles of the null and alternative hypotheses, the meaning of a p-value, and the concept of statistical significance. Mastering this logic is the essential first step before we can start performing actual statistical tests in R.
From Research Question to Statistical Hypotheses
Your goal is to conduct analyses for clinical and academic research. In this world, everything begins with a question. For instance, a researcher might ask: "Does our new drug reduce recovery time for a specific illness compared to a placebo?"
This is a great research hypothesis—a substantive scientific claim. However, to test it with data, we need to translate it into a mathematically precise statistical hypothesis. A statistical hypothesis makes a specific claim about a characteristic of the population, such as the average (mean) recovery time.
- The research hypothesis: "The new drug is effective."
- The statistical hypothesis: "The mean recovery time for patients taking the drug is less than the mean recovery time for patients taking the placebo."
The book Learning statistics with R provides an excellent discussion on this distinction.
This reading will help you understand the crucial difference between the broad scientific questions you want to answer and the specific, testable statistical claims you'll formulate.
In Chapter 11, please read the subsection on research vs. statistical hypotheses. Pay close attention to how the author maps a general idea (like "ESP exists") to a precise statement about a population parameter (\theta \neq 0.5).
The Logic of the Courtroom: The Null Hypothesis
Now for the counterintuitive part. In statistics, we don't try to prove our research hypothesis is true. Instead, we try to prove that a competing hypothesis, one of "no effect," is false. This is the bedrock of the frequentist approach to statistics.
This "no effect" hypothesis is called the null hypothesis (). It's the default, skeptical position. The hypothesis that the researcher actually wants to prove is called the alternative hypothesis ( or ).
For our drug trial example:
- Null Hypothesis (): There is no difference in mean recovery time between the drug and placebo groups. Any difference we see in our sample is just due to random chance. ()
- Alternative Hypothesis (): The mean recovery time for the drug group is less than the placebo group. The difference we see is a real effect. ()
A powerful analogy, described in Learning statistics with R, is that of a criminal trial.
This section introduces the core logic of hypothesis testing using a very intuitive analogy.
Please read the subsection Null and alternative hypotheses. Focus on the "criminal trial" analogy, where the null hypothesis is the defendant, presumed innocent until proven guilty beyond a reasonable doubt.
But why start with this "no difference" idea? Why not just test if the difference is, say, 15 hours, if that's what we saw in a preliminary study? The StatQuest video below explains why the null hypothesis provides a much more robust and practical starting point.
Hypothesis Testing and The Null Hypothesis, Clearly Explained!!!
Josh Starmer from StatQuest provides a clear, example-driven explanation for why the null hypothesis is so useful and how it simplifies the testing process.
Please watch the section that defines the null hypothesis and explains its advantages. Then, watch the final summary of this concept. The key takeaway is how the null hypothesis allows us to test for any difference without needing preliminary data to form a specific hypothesis.
The Evidence: P-values and Significance
Once we have our hypotheses, we collect data and perform a statistical test. The test summarizes the evidence in a single number: the p-value.
The p-value is one of the most important—and most misunderstood—concepts in statistics. Here is the formal definition:
The p-value is the probability of observing a result at least as extreme as the one you actually got, assuming the null hypothesis is true.
A low p-value means your observed data is very surprising if there's truly no effect. This surprise is evidence against the null hypothesis.
The following video offers a concise and clear explanation of what a p-value represents in the context of a clinical study.
What Is a P-Value? A Simple Explanation!
This video from Let's Learn Public Health breaks down the definition of a p-value using a straightforward example, which will help solidify your understanding.
Watch the video from the introduction of the p-value to the end of the drug trial example. Focus on how the p-value is framed as a probability conditional on the null hypothesis being true.
It is crucial to avoid a common mistake: the p-value is NOT the probability that the null hypothesis is true. As the Learning statistics with R text emphasizes, this is an incorrect interpretation. The null hypothesis is either true or false; the p-value simply quantifies how compatible our data is with it.
The Verdict: Making a Decision
So, how low does a p-value need to be for us to reject the null hypothesis? We need a pre-defined threshold for our "reasonable doubt." This threshold is the significance level, denoted by the Greek letter alpha ().
- By convention, is often set to 0.05 (or 5%).
- If our calculated p-value < , we reject the null hypothesis. We conclude the result is statistically significant.
- If our calculated p-value ≥ , we fail to reject the null hypothesis. The result is not statistically significant.
Notice the language: we "fail to reject," we don't "accept" the null hypothesis. Like a "not guilty" verdict, it doesn't mean the defendant is innocent; it just means the prosecution didn't provide enough evidence for a conviction.
Every decision carries a risk of error. In hypothesis testing, there are two types of errors we can make.
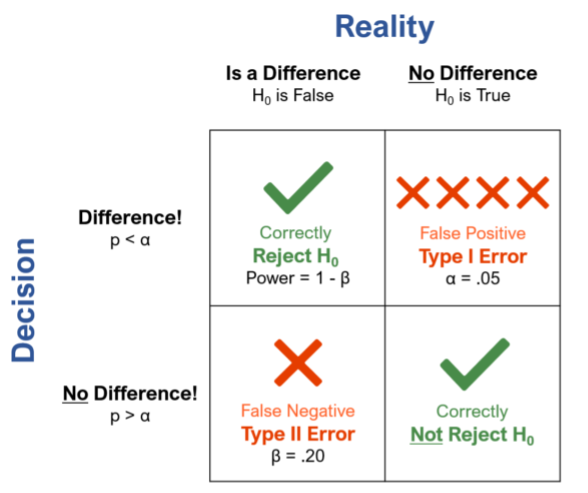
- Type I Error (False Positive): We reject the null hypothesis when it is actually true. This is like convicting an innocent person. The probability of making a Type I error is equal to our significance level, .
- Type II Error (False Negative): We fail to reject the null hypothesis when it is actually false. This is like letting a guilty person go free. The probability of this error is denoted by beta ().
The Learning statistics with R text provides a fantastic explanation of this trade-off.
This section connects the concepts of decision-making, significance, and the two types of errors using the criminal trial analogy.
Please read Section 11.2, Two types of errors. Focus on how \alpha controls the Type I error rate and the inherent trade-off between the two types of errors.
Finally, it's vital to distinguish between statistical significance and practical significance. A tiny p-value might show a statistically significant effect, but the effect size could be so small that it's meaningless in a real-world clinical setting.
The Process in Five Steps
We can summarize this entire logical framework with a clear, step-by-step process.

Here is how the concepts we've discussed map onto this process:
- Step 1: Null and alternative hypotheses. Formulate (no effect) and (the effect you're looking for).
- Step 2: Set a significance level. Choose your , the risk you're willing to take of making a Type I error (usually 0.05).
- Step 3: Collect data and conduct tests to produce a p-value. This is the number-crunching step we will learn to do in R.
- Step 4: Reject or fail to reject the null hypothesis. Compare your p-value to .
- Step 5: Interpret the result. Translate your statistical decision back into the context of your original research question.
Conclusion
In this lesson, you have learned the complete logical architecture of hypothesis testing. This framework is the engine of statistical inference and is fundamental to interpreting and conducting quantitative research.
Key Takeaways:
- Hypothesis testing provides a formal procedure to assess evidence against a claim of "no effect."
- We start with a null hypothesis () of no difference and an alternative hypothesis () representing the effect we want to find.
- The p-value measures how surprising our data is if the null hypothesis were true. A small p-value is strong evidence against .
- The significance level () is a pre-set threshold for making a decision. If , we reject .
- Rejecting when it's true is a Type I error (probability ). Failing to reject a false is a Type II error.
- A "statistically significant" result is not automatically "practically important."
Preview of the Next Lesson:
Now that you understand the "why" of hypothesis testing, we will begin exploring the "how." In the next lesson, you will learn to calculate and interpret fundamental descriptive statistics in R. We will also introduce some of the common probability distributions, like the Normal distribution, which form the mathematical basis for calculating p-values in many statistical tests.