Hello! Welcome back to our module on Marketing Dashboards & Reporting.
In our last lesson, you transformed your dashboard from a static page into a dynamic analysis tool by adding date and filter controls. Now, stakeholders can explore the data on their own terms. Today, we'll add one of the most critical visualizations for any hotel marketer to that dashboard.
This lesson focuses on the learning outcome: Visualize the booking funnel and key conversion rates in a dashboard. You'll learn how to map out the customer's journey on your website—from first looking at a room to completing a booking—and pinpoint exactly where potential guests are dropping off.
1. Understanding the Hotel Booking Funnel
As a hotelier, you're intimately familiar with the guest's journey. The booking funnel is simply the digital version of that path. It visualizes how many users complete each step towards making a reservation, helping you answer crucial questions like:
- "How many people who look at our 'Deluxe King Room' page actually start the booking process?"
- "Where is the biggest drop-off? Is it when we ask for payment details?"
- "Does our mobile booking process have a 'leak' that our desktop version doesn't?"
By visualizing this, you can stop guessing and start making data-driven improvements to your website and booking engine to increase direct bookings.
The stages of your funnel will correspond to the key GA4 events you've set up to track your booking engine. A typical hotel booking funnel might look like this:
- Viewed Room: The user views a specific room details page (e.g., GA4 event
view_itemor a customview_room). - Began Checkout: The user selects dates and clicks "Book Now" (e.g., GA4 event
begin_checkout). - Added Payment Info: The user enters their payment details (e.g., GA4 event
add_payment_info). - Completed Booking: The user successfully completes the reservation (e.g., GA4 event
purchase).
2. Methods for Visualizing Funnels in Looker Studio
There are several ways to build a funnel in Looker Studio. Until recently, it required clever workarounds. Now, there is a dedicated, native chart type for this.
Let's get a quick overview of the different approaches.
Funnel Visualization in Looker Studio
The video 'Funnel Visualization in Looker Studio' by MeasureSchool provides an excellent overview of the different methods available, including using community visualizations and standard tables. We will focus on the concepts rather than the specific implementation details.
Watch the first minute of the video (00:00 - 01:02). The goal is to understand that there are multiple ways to build a funnel, each with its own trade-offs.
For this lesson, we will focus on the most modern and straightforward method: using Looker Studio's native Funnel chart. It's designed specifically for this purpose and is the best place to start.
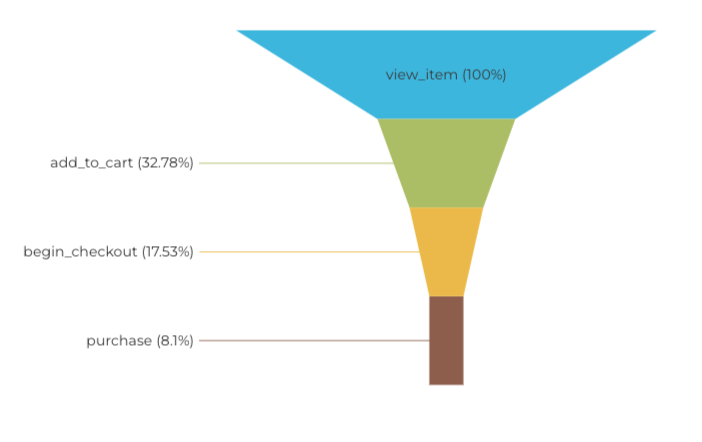
This is the type of funnel chart we will build. It clearly shows the drop-off at each stage of the user journey.
3. Building Your Booking Funnel Visualization
Let's add a funnel chart to the interactive dashboard you've been building. We will configure it to show your hotel's booking journey.
Funnel chart in Looker Studio: A step‑by‑step guide for ...
The guide 'Funnel chart in Looker Studio' from lookercourses.com provides a clear, step-by-step process for creating and configuring the native funnel chart. We'll follow these steps, adapting them for our hotel context.
Read through Step 1 to Step 4 of the article and follow along in your Looker Studio report. Step 1 & 2: Connect your GA4 data source (already done) and add the Funnel chart to your canvas. Set the Dimension to Event name and the Metric to Total users. Step 3: This is the most important step. Create a filter to isolate only the events in your booking funnel. In the Setup panel, click Add a Filter. Use a Regular Expression Match with the event names for your hotel booking funnel. For example: view_item|begin_checkout|add_payment_info|purchase. Use the event names that are relevant to your GA4 setup. Step 4: Raw event names aren't very friendly. Follow the instructions to create a new calculated field called 'Funnel Stage'. Use a CASE statement to rename the events into clear, readable labels for your team. Here is a template you can adapt: CASE WHEN Event name = 'view_item' THEN "1. Viewed Room" WHEN Event name = 'begin_checkout' THEN "2. Began Booking" WHEN Event name = 'add_payment_info' THEN "3. Added Payment" WHEN Event name = 'purchase' THEN "4. Completed Booking" END Note: The numbers are important! They force Looker Studio to sort the funnel in the correct order. After creating this field, use it as the Dimension for your funnel chart.
4. Displaying Key Conversion & Drop-Off Rates
Your funnel chart now shows the number of users at each stage. But the real insight comes from the rates—what percentage of users move from one step to the next?
Step-by-Step Conversion Rate
The native funnel chart makes this easy.
- Select your funnel chart.
- Go to the Style panel on the right.
- Find the Data label section.
- For Percentage type, select vs previous step.
Now, your funnel shows the conversion rate from one stage to the next, instantly highlighting the leakiest parts of your booking process.
Test your understanding!
You see the following data in your funnel:
- 2. Began Booking: 1,000 users
-
- Added Payment: 600 users (60%)
Then, you notice:
- 4. Completed Booking: 300 users (50%)
Where is the bigger "leak" in your funnel, and what might you investigate?
Show answer
The bigger leak is between "Added Payment" and "Completed Booking". While 60% of users who started the booking added payment info, only 50% of those who added payment info actually completed the booking. This suggests a potential issue on the final confirmation page or with the payment processing itself. You might investigate if there are payment gateway errors, a confusing final step, or unexpected taxes/fees being added at the very end.
Calculating Overall and Specific Rates with Scorecards
While the funnel chart is great, sometimes you want to display key metrics as big, bold numbers for stakeholders. We can do this using Scorecards and a powerful technique called Data Blending.
Let's calculate the two most important top-line metrics:
- Overall Booking Conversion Rate: (Total Bookings / Total Users who Viewed a Room)
- Checkout Abandonment Rate: (The percentage of users who start booking but don't finish)
The following video demonstrates how to use scorecards and data blending to calculate these kinds of rates. The example is for an e-commerce funnel, but the principles are identical.
Item-based funnel in Looker Studio using GA4 data
The video 'Item-based funnel in Looker Studio' by Analytics Mania provides a masterclass in calculating custom conversion and abandonment rates. We will focus on the section where data blending is used to create these metrics.
Watch the segment from 05:45 to 09:00. In this part, the instructor blends two scorecards to calculate a completion rate and an abandonment rate. Follow this logic to create two crucial metrics for your dashboard: Create an Overall Conversion Rate Scorecard: Add two separate scorecards. Filter one for your 'Viewed Room' event and the other for your 'Completed Booking' event. Select both scorecards, right-click, and choose Blend data. Edit the blended metric's formula to be SUM(Total users from 'purchase' scorecard) / SUM(Total users from 'view_item' scorecard). Format it as a percentage. Place this scorecard prominently on your dashboard. Create a Checkout Abandonment Rate Scorecard: Follow the same process, but this time use scorecards for 'Began Booking' (begin_checkout) and 'Completed Booking' (purchase). The formula for abandonment is 1 - (SUM(purchase users) / SUM(begin_checkout users)). This shows the percentage of users who started but didn't finish. In the Style tab for this scorecard, consider changing the font color to red to draw attention to this drop-off.
Now you have a complete view: a visual funnel showing the journey and standout scorecards highlighting the most important conversion and abandonment rates. Remember the interactive filters you added in the last lesson? You can now use them to see how your booking funnel and conversion rates change by device, country, or traffic source!
Conclusion
Fantastic work! You have now added a sophisticated and highly valuable visualization to your marketing dashboard. You can precisely track your hotel's booking funnel, identify where users are dropping off, and quantify the impact with clear conversion and abandonment rates.
Key Takeaways:
- A booking funnel visualizes the user journey from browsing rooms to completing a reservation.
- Looker Studio's native Funnel chart is the most direct way to build this visualization, using filtered
Event namedata from GA4. - Using a
CASEstatement to create readable labels is crucial for making your dashboard understandable to stakeholders. - Calculating step-by-step conversion rates within the funnel chart pinpoints the "leakiest" stages.
- Scorecards and Data Blending allow you to calculate and prominently display critical KPIs like the overall conversion rate and checkout abandonment rate.
What's Next?
Your dashboard is now packed with actionable insights. But a dashboard is only useful if people see it. In our final lesson for this module, we will address the learning outcome: Set up automated email delivery of Looker Studio reports. You'll learn how to schedule and send your dashboard directly to your team's inbox, ensuring everyone stays informed and aligned.