Hello! Welcome back to our module on Marketing Dashboards & Reporting.
In our last lesson, you built the foundation of your hotel's marketing dashboard by creating scorecards for key KPIs and a time-series chart to track user trends. The result is a clear, at-a-glance view of performance, but it's currently a static snapshot.
Today, we'll bring that dashboard to life. This lesson addresses the learning outcome: Add filters and date controls to make dashboards interactive for stakeholders. You will learn how to empower your team—from the General Manager to the front desk manager—to explore the data and answer their own questions. Instead of a fixed report, you'll have a dynamic tool that can be sliced and diced to uncover deeper insights.
1. From Static Report to Interactive Tool
A static report is like a printed brochure—it presents information one way. An interactive dashboard is like a website—it invites exploration. By adding controls, you allow stakeholders to ask questions like:
- "How did our bookings from the UK perform last quarter?"
- "Are mobile users converting as well as desktop users?"
- "What was the impact of that Easter promotion we ran in April?"
This not only makes the dashboard more valuable but also saves you the time of creating dozens of report variations. Let's explore the concept of interactivity.
How to Make Your Looker Studio Dashboards Interactive
The article 'How to Make Your Looker Studio Dashboards Interactive' from MeasureSchool provides a great introduction to why interactivity is crucial. It explains how controls transform a report from a static page into a powerful analytical tool.
Read the introduction and the section 'Adding Interactive Elements to Looker Studio Dashboards' to understand the limitations of a static report and the potential of an interactive one. The specific examples given (filtering by location, gender, or traffic source) are directly applicable to a hotel context.
2. The Most Essential Control: Date Range
The first and most important control for almost any dashboard is the Date Range Control. It allows users to select the specific time period they want to analyze.

Let's add one to the dashboard you created in the last lesson.
How to Make Your Looker Studio Dashboards Interactive
We'll return to the MeasureSchool article for clear, step-by-step instructions on adding this control.
First, read the short section 'Date Range Filters' to solidify the concept. Then, jump to the end of the article, find the heading 'Let’s quickly see how to add a Date Range Filter...', and follow the simple steps provided. Add a date range control to the top-right corner of your dashboard. In the properties panel on the right, set the 'Default date range' to 'Last 28 days'.
With just that one addition, your dashboard is already significantly more useful. A manager can now check performance for "This quarter to date" or compare this year's summer season to the last.
3. Slicing the Data with Filter Controls
Now for the real exploratory power: filter controls. These let users segment the data by different dimensions. For your hotel, this could mean filtering by traffic source, user location, or device type.
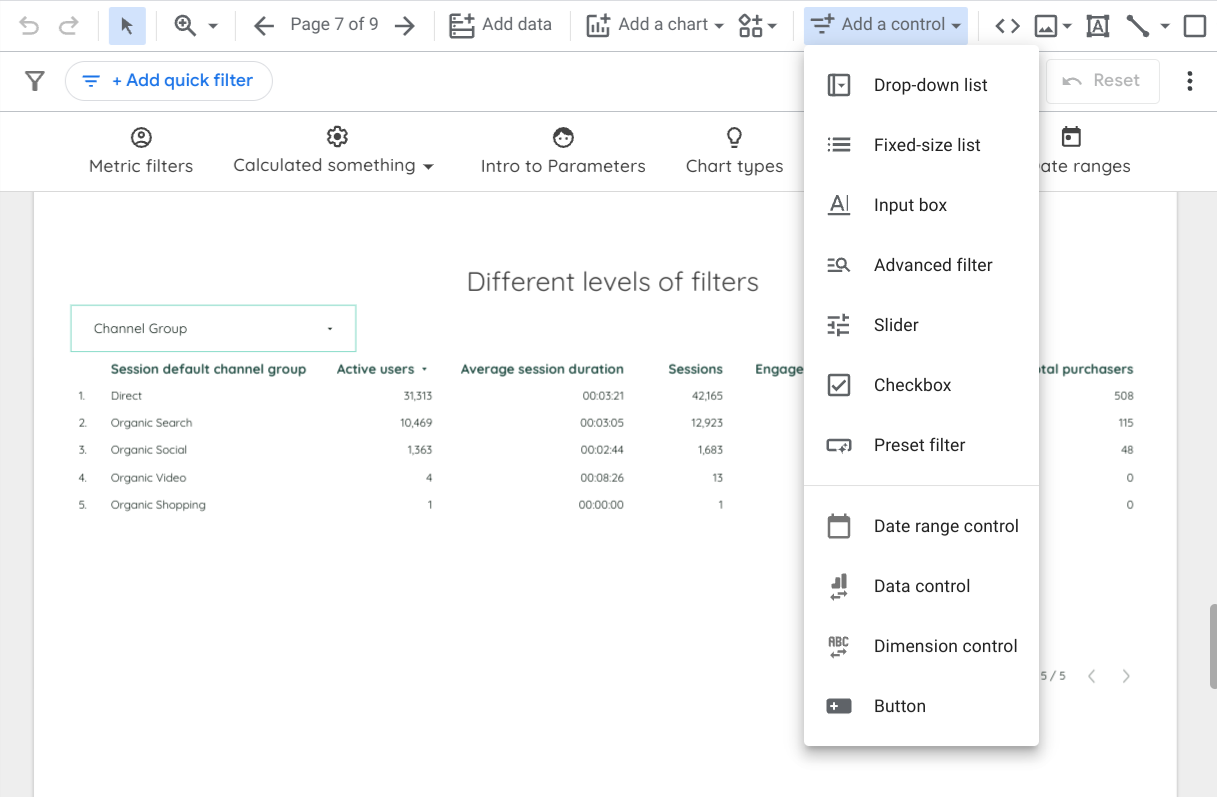
To understand the main types of controls and how to use them, let's consult a comprehensive guide.
How to use controls in Looker Studio
The article 'How to use controls in Looker Studio' from Catchr.io provides an excellent overview of the different control types available and their use cases. This will serve as our reference for this section.
First, read 'What are controls in Looker Studio?' to understand the difference between a static filter and an interactive control. Then, read the 'Selection controls' section to learn about the 'Drop-down list' and 'Fixed-size list', which we'll be implementing.
Implementing Your First Filters
Let's add two practical filters to your dashboard: one to see performance by traffic channel and another to see it by device. We'll use a video tutorial for a clear visual demonstration of the process.
11.8. Filter Controls (Looker Studio Tutorial) (Advanced Google Data Studio Course)
The video 'Filter Controls (Looker Studio Tutorial)' by Siavash Kanani offers a detailed, hands-on look at configuring different filter types. We'll use it to guide our implementation.
Watch from the beginning to 02:16. Follow along in your own Looker Studio report: Add a Drop-down list (00:00 - 01:35): Place this control on your dashboard. In the 'Setup' panel on the right, set the Control field to Session default channel group. This will allow users to filter the dashboard to see data only from 'Organic Search', 'Paid Search', 'Direct', etc. Add a Fixed-size list (01:35 - 02:16): Place this control next to the first one. For its Control field, select Device category. This is perfect for a fixed-size list because there are only three options (Desktop, Mobile, Tablet), and users can see them all at once.
Now, switch to "View" mode in Looker Studio. Try using your new controls. Filter to see only "Mobile" traffic. Then, see how "Paid Search" performed over the date range you select. You've just built a powerful, interactive analysis tool!
Test your understanding!
You want to give your sales team a way to filter the dashboard by the potential guest's country of origin. Which type of filter control would be most appropriate for this, and why?
Show answer
A drop-down list would be the most appropriate control. The list of countries is very long, so a drop-down list with a search function is much more user-friendly than a fixed-size list, which would take up too much space on the report.
4. Fine-Tuning Interactivity: Scope and Cross-Filtering
Two final concepts will complete your understanding of dashboard interactivity.
Control Scope: By default, a control only affects the page it's on. However, you can make a control report-level, meaning it will appear on every page of your report and apply its filter globally. This is a best practice for date range controls. To do this, simply right-click your date range control, and select Make report-level.
Chart Cross-Filtering: You can also turn your charts into filters. This allows a user to click on a data point in one chart (e.g., clicking 'Desktop' in a pie chart) and have it filter the entire page.
To enable this, select one of your charts (like the time series chart), go to the bottom of the Setup panel on the right, and under the Interactions section, check the box for Cross-filtering. Now in 'View' mode, you can click and drag over a section of your time series chart to "zoom in" and filter all other charts to that specific time frame.
Conclusion
Congratulations! You have successfully transformed your static report into a dynamic and interactive dashboard. By giving stakeholders the ability to filter by date, traffic source, and device, you've multiplied the value of your report and empowered your team to make more informed, data-driven decisions.
Key Takeaways:
- Interactive dashboards empower users to answer their own questions, making your reports more valuable and versatile.
- The Date Range Control is the most fundamental interactive element, allowing for flexible time-based analysis.
- Filter Controls like drop-down and fixed-size lists enable users to segment data by key dimensions (e.g.,
Session default channel group,Device category). - Making controls report-level ensures consistency across multi-page reports, while cross-filtering turns your charts into intuitive, interactive filters.
What's Next?
With a fully interactive dashboard framework in place, we can now add more specialized visualizations. In the next lesson, we will tackle the learning outcome: Visualize the booking funnel and key conversion rates in a dashboard. You'll learn how to build a funnel exploration report to identify exactly where users are dropping off in the booking process—and your new interactive filters will allow you to see if those drop-off points differ by device, country, or traffic source.