Hello! Welcome back to our module on Marketing Dashboards & Reporting.
In the last lesson, we completed the crucial first step of connecting your Google Analytics 4 (GA4) and Google Ads accounts as data sources in Looker Studio. With the data pipeline now in place, we can move on to the exciting part: bringing that data to life.
Today's lesson addresses the learning outcome: Build a marketing KPI dashboard in Looker Studio showing performance over time. We will transform your blank Looker Studio report into a functional dashboard that provides an at-a-glance overview of your hotel's website performance. By the end of this session, you will have created your first set of KPI scorecards and a time-series chart to track trends.
1. The Strategic Foundation: What Makes a Great Hotel Dashboard?
Before we start dragging and dropping charts, it's essential to think strategically. A dashboard isn't just a collection of metrics; it's a tool designed to answer critical business questions quickly. For a hotel, the most important question is usually: "Is our marketing driving profitable bookings?"
Many dashboards fail because they are too technical or cluttered. A successful dashboard tells a clear story to stakeholders, from marketing to management and finance.
To ground our work in best practices for the hospitality industry, let's explore what KPIs matter most for a hotel.
Hotel marketing dashboard that everyone understands
The article 'Hotel marketing dashboard that everyone understands' from Digisap provides an excellent framework for thinking about which metrics truly matter for a hotel. It cuts through the noise of vanity metrics to focus on business impact.
Please read the sections '3. Core framework: how a dashboard should be structured' and '4. The KPIs every hotel marketing dashboard must include'. Pay close attention to the core question the dashboard should answer and the list of recommended KPIs.
As the article highlights, your dashboard should focus on metrics that connect directly to revenue and profitability. The key KPIs for a hotel include:
- Total revenue attributed to marketing
- Return on Ad Spend (ROAS)
- Cost per Booking (CPB) / Cost Per Acquisition (CPA)
- Website Sessions & Users
- Booking Conversion Rate
Today, we'll start by building the top of this hierarchy: visualizing the core website traffic and conversion metrics from your GA4 data source.
2. Building Your First Dashboard
Let's get practical. Open Looker Studio and create a Blank Report. When prompted, select your GA4 data source that you connected in the last lesson.
Step 2.1: Setting the Stage
A professional dashboard is clean and well-organized. Let's set up the canvas before adding our data visualizations. This includes giving it a title and a consistent look and feel.
The following video provides a clear walkthrough of how to build a dashboard from scratch. We'll follow its guidance for setting up the page and then for creating our visualizations.
Digital Marketing Dashboard: GA4 Traffic Sources in Looker Studio
This video from Growth Learner is a practical step-by-step guide to building a GA4 dashboard. We will use it to create the main components of our report.
First, watch from 01:26 to 03:30. Follow along to give your report a title (e.g., 'Hotel Website Performance Overview'), set a background color, and adjust the page dimensions.
Step 2.2: At-a-Glance Metrics with Scorecards
Scorecards are perfect for displaying your most important top-level KPIs. They show a single, crucial number, often with a comparison to a previous period to show the trend. We'll place a row of these at the top of our dashboard for an immediate performance check.
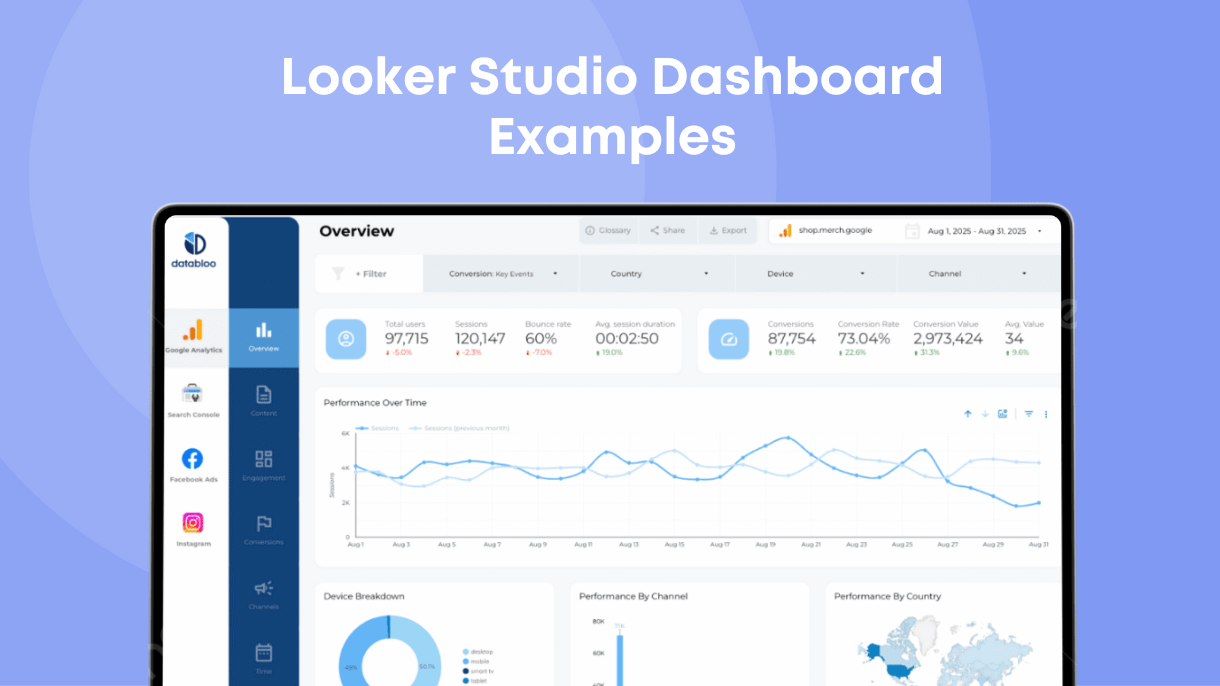
Let's continue with the video to build these.
Digital Marketing Dashboard: GA4 Traffic Sources in Looker Studio
We'll now add our key performance indicators using scorecards. This part of the tutorial shows you exactly how to add them, select the right metric from GA4, and style them.
Watch from 06:20 to 09:43. Follow the steps to create scorecards for: Total Users Sessions Engagement Rate Conversions (this will show the total count of all conversion events you've configured in GA4). Pay attention to how a comparison date range ('previous year' or 'previous period') is added to show performance trends.
By completing this step, you've already created the most essential part of a KPI dashboard: a clear, concise summary of top-level performance.
Test your understanding!
You want to add another scorecard to show the total revenue from bookings. Assuming you have e-commerce tracking set up correctly in GA4, which metric would you most likely select for this scorecard?
Show answer
You would search for and select the Purchase revenue metric from your GA4 data source. This metric specifically captures the value associated with e-commerce transactions.
3. Visualizing Performance Over Time
Scorecards give us a snapshot, but they don't show the journey. Did we have a huge spike in users last week? Is our conversion volume slowly trending down? A time series chart is the perfect tool to answer these questions. It plots a metric over a selected date range, revealing trends, patterns, and seasonality.
To understand the fundamentals of creating a time series chart, this article provides a great overview.
How to Visualize Data Over Time in Looker Studio Reports
This guide from Gaille Reports focuses specifically on how to create effective time series charts. It covers the basics of setup and styling.
Read 'Step 1: Add a Time Series Chart and pick the basic layout' and 'Step 2: Clean up titles and alignments'. This reinforces the initial setup process.
Now, let's put that theory into practice. We'll return to our video guide to add a time series chart below our scorecards.
Digital Marketing Dashboard: GA4 Traffic Sources in Looker Studio
Let's add a time series chart to visualize user trends. This part of the video demonstrates how to add the chart and configure it to show one or more metrics over time.
Watch from 11:30 to 12:45. The video creates a chart comparing 'Total users' and 'New users'. For your dashboard, start by creating a time series chart with just one metric: Total Users. Make sure the dimension is set to Date.
Now you have a chart that shows the daily, weekly, or monthly rhythm of visitors to your hotel's website. You can immediately spot which days are busiest and see the overall trend across the selected period.
Conclusion
Well done! You have successfully built your first marketing KPI dashboard. While simple, it's a powerful tool that transforms raw data into actionable insights. You've learned not just the "how" of adding charts, but also the "why" behind selecting the right KPIs for a hotel business.
Key Takeaways:
- Strategy First: A good dashboard answers key business questions. For a hotel, this revolves around profitable revenue generation.
- Scorecards for Summaries: Use scorecards at the top of your dashboard to display the most critical, high-level metrics for quick review.
- Time Series for Trends: Use time series charts to visualize how your KPIs are performing over time, helping you identify patterns, seasonality, and the impact of your marketing efforts.
- Start Simple: A clean dashboard with a few key metrics is more effective than a cluttered one with dozens.
What's Next?
Our dashboard is informative, but it's still static. What if your manager wants to see performance just for last quarter? Or only for traffic from mobile devices?
In our next lesson, we will focus on the learning outcome: Add filters and date controls to make dashboards interactive for stakeholders. You'll learn how to empower your users to explore the data for themselves, turning your report into a dynamic and even more valuable tool.