Introduction
Welcome to the final lesson of the "Control Planning and Project Closure" module. In our last session, we mastered the critical skill of calculating a project's financial impact, distinguishing between hard and soft savings to build a credible business case. Those calculations are a cornerstone of what we'll discuss today.
This lesson addresses the final step in the DMAIC process: compiling a final project report to summarize your findings, solutions, and lessons learned for project closure. A well-crafted report does more than just close out a project; it serves as the project's legacy. It communicates the value delivered, ensures the gains are sustained, and transfers knowledge to the entire organization, preventing future teams from "reinventing the wheel."
For you, moving towards a Black Belt role, creating a comprehensive and compelling project report is a key competency. It's how you formally communicate the success of your work to sponsors, stakeholders, and leadership.
1. The Importance of Formal Project Closure
Before we dive into the structure of the report, let's establish why a formal closure process is so critical. As an experienced professional, you've likely seen improvements that fade over time. A robust closure process is the primary defense against this. It ensures a clean hand-off to the process owner and solidifies the project's achievements as part of the new standard operating procedure.
Six Sigma Project Closure: Complete Guide to Final Documentation and Reporting Requirements
To understand the strategic importance of this final phase, please read a short section from the 'Six Sigma Project Closure: Complete Guide' from Lean 6 Sigma Hub. It highlights a common failure point in improvement projects.
Read the section titled 'Understanding the Importance of Proper Project Closure'. Note the statistic about how many improvements deteriorate without proper closure procedures.
The statistic that ~70% of improvements can deteriorate without proper closure procedures underscores the value of what we're covering today. The final report is the primary tool for creating the "infrastructure necessary to maintain those gains."
2. The Anatomy of a Final Project Report
A Six Sigma project report is often called a "storyboard" because it tells the story of the project from beginning to end, following the DMAIC framework. It's a visual and data-driven narrative designed to be easily understood by stakeholders.
Let's look at two practical templates that illustrate the key components.
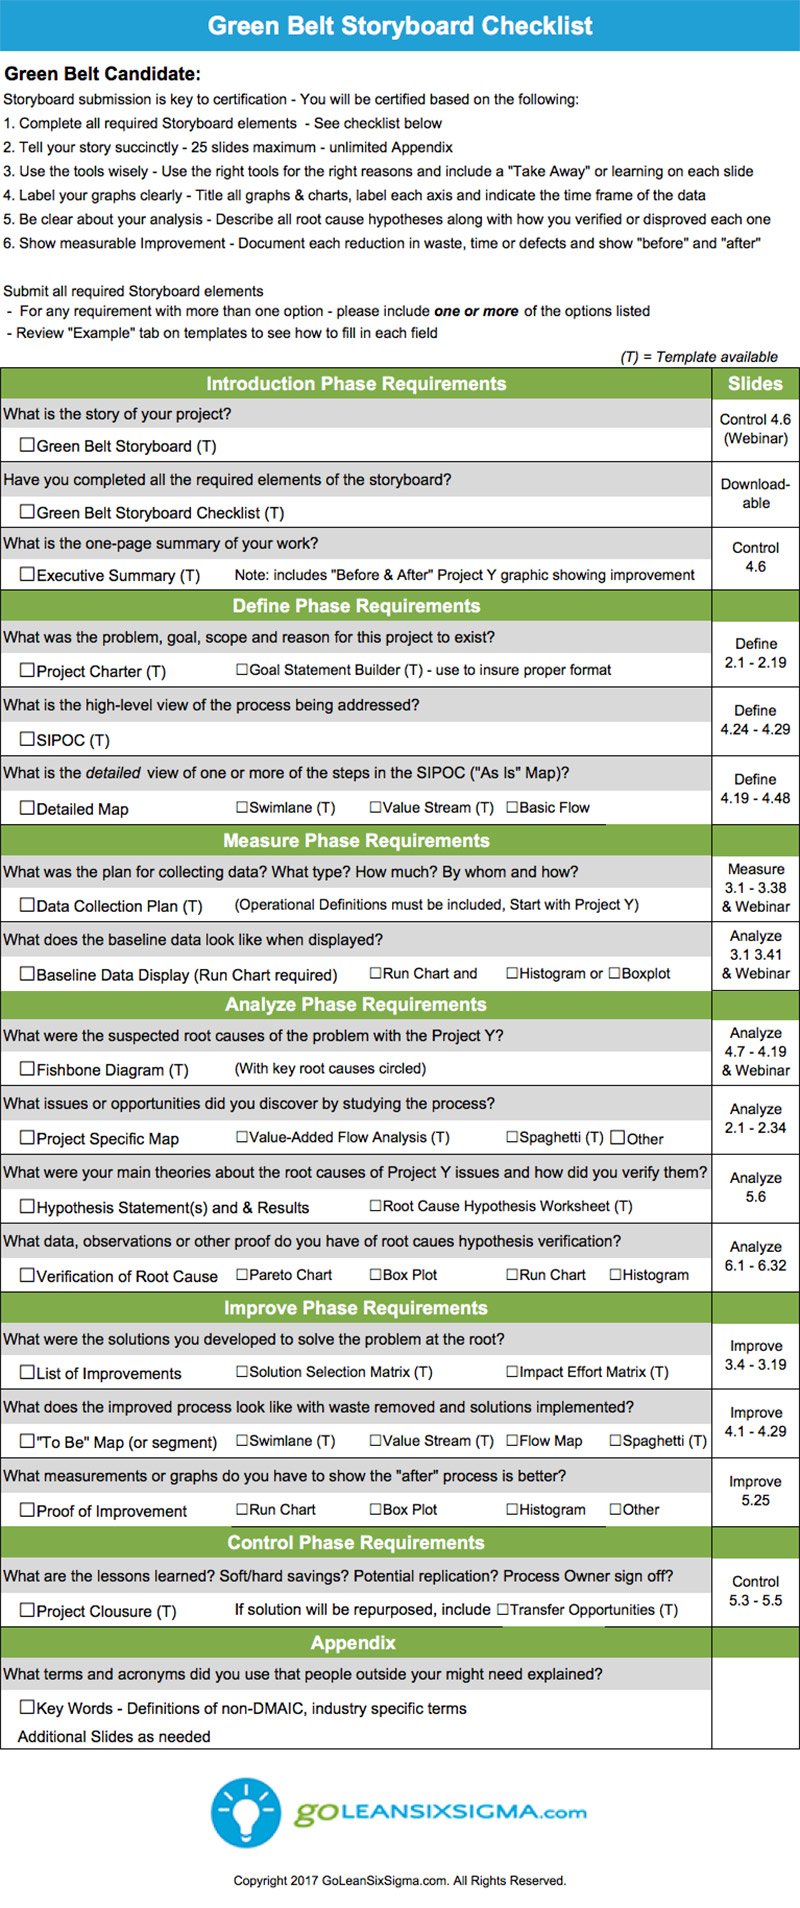
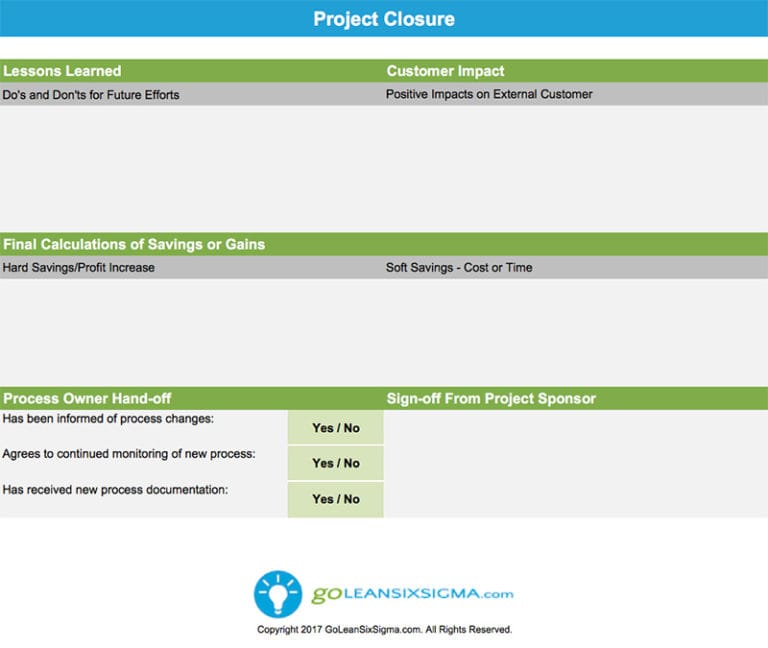
As you can see, the report is a synthesis of all the key tools and analyses you've completed throughout the project. Its purpose is to present the journey logically:
- What was the problem? (Define)
- How big was the problem? (Measure)
- What was the root cause? (Analyze)
- What did we do about it? (Improve)
- How will we sustain the gains? (Control)
3. Creating the Narrative: The "DMAIC on a Page"
Your stakeholders, especially senior leaders, are busy. They need a concise summary that hits all the key points. The "DMAIC on a Page" or "A3 Report" is a powerful tool for this. It condenses the entire project onto a single, digestible slide or page.
The following video provides an excellent walkthrough of how to build this summary. It shows what key information to pull from each phase of your project.
Making a Six Sigma DMAIC on a page in PowerPoint
This video from David McLachlan demonstrates how to create a one-page summary of a DMAIC project. It's a very practical guide to communicating your project's story effectively.
Please watch from the beginning to 08:26. Pay attention to the specific examples of charts, graphs, and documents he suggests including for each of the DMAIC phases in the summary. This will give you a clear idea of how to select the most impactful evidence from your project work.
As the video demonstrates, the summary should be a visual greatest hits of your project. For a typical manufacturing project, this would include:
- Define: The project charter, a high-level SIPOC, and the problem statement (with a run chart showing the initial issue).
- Measure: A summary of your measurement system analysis (e.g., Gage R&R % Study Variation), baseline performance data (e.g., process capability histogram, control chart showing the "before" state).
- Analyze: The key graphical analysis that revealed the root cause (e.g., a Pareto chart of defect types, a box plot comparing shifts), and your validated root causes (often from a Fishbone diagram and subsequent hypothesis tests).
- Improve: A description of the implemented solution (e.g., a new fixture, a change in machine parameters), and pilot results.
- Control: A control chart showing the "after" state (demonstrating stability and improvement), and a reference to the new Control Plan and SOPs.
4. Assembling the Detailed Documentation
While the one-page summary is for communication, the complete project report serves as the official record and knowledge base. It includes the summary but is supported by detailed appendices and documentation. Let's walk through the critical sections, using the comprehensive guide from Lean 6 Sigma Hub.
Six Sigma Project Closure: Complete Guide to Final Documentation and Reporting Requirements
We will now use the Lean 6 Sigma Hub article to structure the detailed components of your final report. This article provides excellent, practical examples for each section.
You don't need to read this all at once. Refer to it as we discuss each component below. I recommend reviewing the sections on 'Final Project Charter Updates,' 'Statistical Analysis and Results Reporting,' 'Financial Impact Documentation,' 'Control Plan Development,' 'Lessons Learned Documentation,' and 'Final Project Presentation.'
a) Final Project Charter
The project charter is a living document. In the final report, you present an updated version that compares the initial goals with the final outcomes. This provides a clear, concise scorecard for the project. The manufacturing example in the "Final Project Charter Updates" section of the article is a perfect illustration of this.
b) Statistical & Performance Reporting ("Before and After")
This is where you prove the improvement with data. The core of this section is a direct comparison of process performance before and after the solution was implemented. This includes:
- Baseline vs. Final Performance: Show side-by-side comparisons of key metrics like Cpk, DPMO, Sigma Level, mean, and standard deviation.
- Statistical Validation: Mention the hypothesis tests (e.g., 2-sample t-test) used to confirm that the improvement was statistically significant, including the p-value.
- Control Charts: A "before" control chart showing the old, unstable, or out-of-spec process next to an "after" control chart showing the new, stable, and in-control process is one of the most powerful visuals in a Six Sigma report.
c) Financial Impact Summary
This section directly incorporates the work from our previous lesson. You must clearly present the financial benefits, validated by your finance department.
- Hard Savings: Detail the calculations for scrap reduction, rework labor savings, reduced overtime, etc.
- Soft Savings: Document any cost avoidance or productivity gains, with clear explanations.
- ROI Calculation: Present the final Return on Investment (ROI) for the project.
d) Control Plan and Process Hand-off
The report must include the final, approved Control Plan. This document, along with updated SOPs, proves that a mechanism is in place to sustain the gains. The report should also include formal sign-off from the Process Owner, confirming they accept responsibility for the new process (as shown in the Project Closure template image).
e) Lessons Learned
This may be the most valuable section for the organization's long-term health. It's a candid assessment of the project execution itself. A good "Lessons Learned" section includes:
- What Worked Well: What should be replicated in future projects? (e.g., "Early engagement with machine operators provided critical insights," "Weekly stakeholder updates were key to maintaining momentum.")
- Challenges and How They Were Overcome: What should future teams be aware of? (e.g., "Initial data collection was hampered by incorrect sensor calibration; future projects should validate data sources first," "Resistance from the second shift was overcome by including their supervisor in the project team.")
This section demonstrates maturity as a project leader and contributes directly to building organizational capability.
Conclusion
You have successfully reached the end of the DMAIC roadmap. Compiling the final project report is the capstone of your work, transforming a series of analyses and actions into a lasting asset for your organization.
Key Takeaways:
- Tell the Story: The final report is a "storyboard" that logically walks stakeholders through the DMAIC journey.
- Start with a Summary: A "DMAIC on a Page" is essential for communicating the project's essence to leadership.
- Prove it with Data: The report's credibility rests on clear, "before and after" comparisons of process metrics and a validated financial impact.
- Ensure Sustainability: Including the Control Plan and Process Owner sign-off demonstrates that the improvements are built to last.
- Share the Wisdom: The "Lessons Learned" section is critical for building organizational capability and is a hallmark of a mature continuous improvement culture.
Preview of the Next Module:
Congratulations on completing all the technical modules of the DMAIC process! Your journey has taken you from defining a problem to verifying the financial impact of your solution.
Our final module, Leading Six Sigma Projects, shifts focus from the technical tools to the leadership and change management skills required to make projects successful. In our next lesson, we will begin with a foundational leadership activity: "Conduct a stakeholder analysis to identify sponsors, champions, and potential resistors." Mastering this will help you navigate the human dynamics that are often the biggest challenge in driving change.