Introduction
Welcome back. In our last session, you created a professional, client-facing setup guide to gain access to a company's analytics tools. That was Day 0 of your audit playbook. Today is Day 1: you have access, and it's time to find the money leaks.
This lesson focuses on the single most common area of friction for any SaaS business: user onboarding. Your goal is to identify onboarding friction points by building signup and activation funnels in Google Analytics 4 (GA4).
We won't be discussing abstract theories. You will learn the specific, repeatable process for using GA4's Funnel Exploration report to pinpoint exactly where a client's onboarding process is failing. By the end of this lesson, you will have a clear framework for turning raw analytics data into your first major, high-value finding in any UX audit.
1. The Anatomy of a SaaS Onboarding Funnel
Unlike a simple e-commerce purchase, a SaaS customer journey is more complex. We need to track a user's path from an anonymous visitor to an engaged, activated user. For an audit, we split this into two distinct funnels.
How to Track SaaS in Google Analytics
First, let's understand the key events that define a SaaS user journey. This article provides a clear framework for what to look for. We will adapt its concepts for our funnels.
Read the introduction ('Why SaaS Analytics is a Unique Challenge') and the section 'Tracking the Full SaaS Funnel: Key Events you Need'. Focus on the 'User Onboarding' and 'Marketing & Acquisition' event categories. These are the building blocks for our funnels.
Based on this framework, here are the two funnels we will build:
1. The Signup Funnel (Pre-Signup)
This funnel tracks the journey from a visitor landing on the marketing site to successfully creating an account. Its purpose is to measure the effectiveness of the marketing site and the signup form itself.
- Common Steps/Events:
page_view(of the signup or pricing page)click(on the "Start Free Trial" CTA)form_start(user interacts with the signup form)form_submit(user submits the form)sign_up(account successfully created - this is the final conversion)
2. The Activation Funnel (Post-Signup)
This funnel tracks the new user's first experience inside the product. Its purpose is to measure if the user is reaching the "aha!" moment—the point where they experience the core value of the product.
- Common Steps/Events:
login(first-time login)tutorial_begin(starts an onboarding checklist or guided tour)tutorial_complete(finishes the tour)feature_used(with a parameter likefeature_nameto specify the core action, e.g., 'create_project', 'send_invoice')
Your First Task in an Audit: Before building anything, you must investigate the client's GA4 setup to find the actual event names they use for these stages. They may not follow these exact names, but the stages will exist.
2. Building the Signup Funnel in GA4
Now, let's build the first funnel. We will use GA4's Funnel Exploration report to visualize the Signup Funnel we just defined.
Funnel exploration in Google Analytics 4 (2026) || Funnel report in GA4
This video is your technical guide to the Funnel Exploration report. We'll use the techniques shown here to build our SaaS-specific funnels.
Watch these key segments to understand the mechanics: Getting Started (00:00 - 00:49): Learn how to find and create a new funnel exploration. Adding Steps (00:49 - 03:07): See how to add events as steps in your funnel. Step Sequencing (03:07 - 04:27): Pay close attention to the difference between 'indirectly followed by' and 'directly followed by'. We will almost always use 'indirectly followed by' to allow for other user actions between steps.
Step-by-Step Guide to Building the Funnel
- In your client's GA4 property, navigate to Explore and select Funnel exploration.
- In the "Tab Settings" column, under Steps, click the pencil icon to edit.
- Delete the default steps.
- Add your first step. For the condition, select
event_nameand find the event corresponding to apage_viewof the signup page. Name the step "Viewed Signup Page." - Click Add step. For the next step, select the event for a trial CTA
click. Name it "Clicked Trial CTA." - Continue this process for
form_submitandsign_up. - Ensure each step is set to is indirectly followed by the next.
- Click Apply in the top-right.
You will now see a visualization of your signup funnel, similar to this:
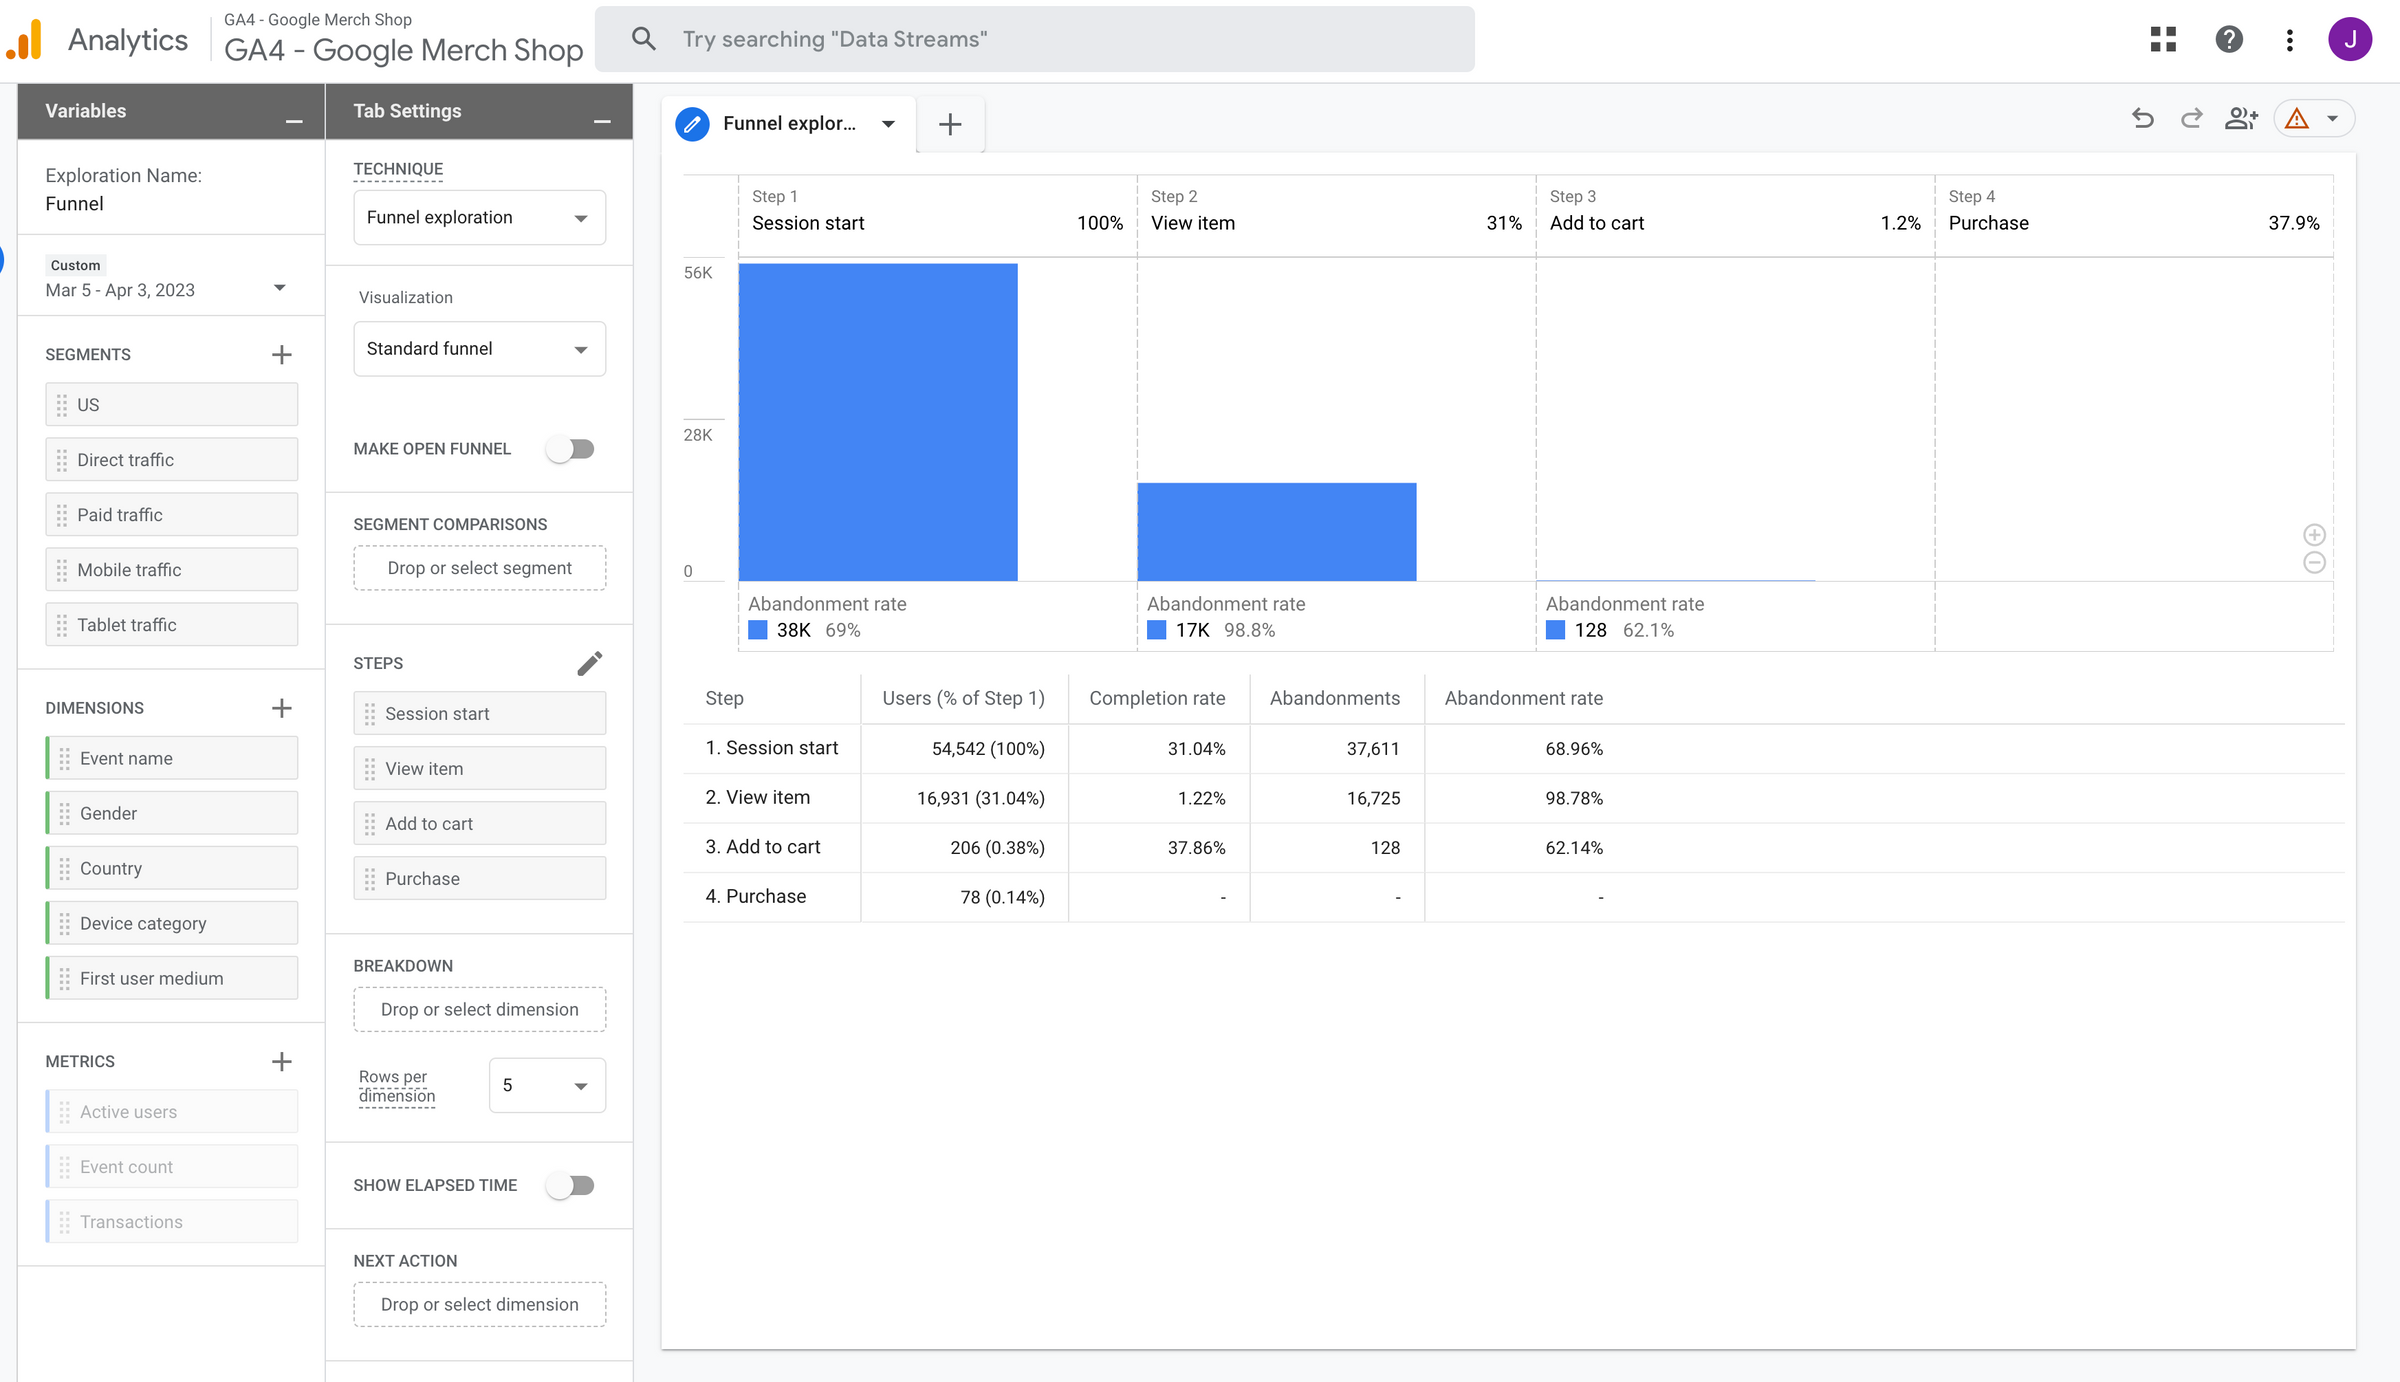
Open vs. Closed Funnels: A Critical Choice
GA4 gives you a toggle to make the funnel "Open" or "Closed."
- Closed Funnel (Default): Users must enter at Step 1. Anyone who skips Step 1 is excluded. Use this to analyze a specific, ideal path you want users to follow.
- Open Funnel: Users can enter the funnel at any step. Use this to discover how people actually navigate, potentially uncovering that many users are skipping your marketing page and landing directly on the signup form.
For a signup funnel, start with a Closed Funnel to analyze the performance of the intended user journey. We can switch to an Open Funnel later to discover alternative paths. For a detailed breakdown of how this works, the segment from 09:44 - 14:18 in the "Funnel exploration in Google Analytics 4" video (LINK) is an excellent reference.
3. Finding the "Why": Using Breakdowns to Isolate Friction
Seeing a 70% drop-off is the what. As a UX consultant, your value comes from finding the why. The Breakdown dimension in GA4 is your primary tool for this.
Let's say you found a massive drop-off between form_start and form_submit. Now you apply a breakdown:
- In the "Tab Settings" column, find the Breakdown section.
- Click and add the
Device categorydimension.
The report will now update to show you the funnel performance for Mobile, Desktop, and Tablet users separately.

Two Essential Breakdowns for Your Audit:
- Device Category: This is often the source of the biggest and easiest-to-fix issues. Always start here.
- First user source / medium: This breakdown tells you where your users came from. You might discover that users from "google / cpc" (paid ads) drop off at a much higher rate than users from "google / organic." This could indicate a mismatch between your ad copy and your landing page experience.
4. Building the Activation Funnel
The process for the Activation Funnel is identical, but the context and events are different.
- Events:
login->tutorial_begin->tutorial_complete->core_feature_used. - Funnel Type: For the Activation Funnel, an Open Funnel is usually better. A user might not complete the onboarding tour in their first session. An open funnel allows you to track users who come back later and engage with these activation events, giving you a more accurate picture of product adoption over time.
- Prerequisite: This analysis depends entirely on the client having implemented User ID tracking, as discussed in the "How to Track SaaS in Google Analytics" resource. This connects a user's actions across multiple sessions after they log in. You should have already confirmed this during your initial setup and data validation.
A high drop-off in the activation funnel is a critical business problem. For example, if only 10% of signed-up users ever complete the tutorial (tutorial_complete), it means 90% are being left to figure out the product on their own, dramatically increasing the likelihood of churn.
Action: Create Your Funnel Analysis Worksheet
To make this process repeatable and client-ready, you will create a template in Figma. This worksheet will structure your analysis for every funnel you investigate.
-
Create a new Frame in your Figma project, titled "Funnel Analysis Worksheet."
-
Create the following sections:
- Funnel Name: (e.g., "SaaS Signup Funnel")
- Funnel Goal: (e.g., "Measure conversion from pricing page to successful account creation.")
- Funnel Steps & GA4 Events:
- Create a simple table with two columns: "Step Name" and "GA4 Event Name."
- Fill it out (e.g., Step 1: "Viewed Signup Page", Event:
page_viewwith filterpage_locationcontains '/signup').
- Initial Analysis:
- Add a placeholder for a screenshot of the main GA4 funnel report.
- Highest Drop-off Point: Add a text field to write which step has the highest abandonment rate and the percentage (e.g., "Step 3: Form Submit - 72% Abandonment").
- Breakdown Analysis & Hypothesis:
- Device Breakdown: Add a placeholder for the device breakdown screenshot.
- Insight: Text field (e.g., "Mobile abandonment is 85%, vs. 40% on Desktop.").
- Hypothesis: Text field (e.g., "The signup form has usability issues on mobile, such as difficult-to-use input fields or a broken submit button.").
- Source/Medium Breakdown: Add a placeholder and fields for Insight and Hypothesis.
- Actionable Recommendation:
- A concluding text box: "Primary friction point is [describe problem]. Recommend [suggest action, e.g., conducting a usability test of the mobile signup flow immediately]."
This worksheet is now a deliverable. It's the "evidence file" you will use to build your final audit report.
Conclusion
You now have a powerful, tactical skill in your arsenal. You can move beyond simple page-view analytics and dissect the most critical flows in a SaaS business.
Key Takeaways:
- SaaS onboarding is best analyzed through two separate funnels: Signup (pre-login) and Activation (post-login).
- GA4's Funnel Exploration is your tool, but the real insights come from Breakdowns (especially by Device and Source).
- Use a Closed Funnel to analyze a specific, intended path and an Open Funnel to understand more flexible, multi-session behaviors like activation.
- Your analysis should always lead to a specific, testable hypothesis about why users are dropping off.
Preview of the Next Lesson:
You've learned to identify friction points where users abandon the onboarding process. In our next lesson, we will escalate the stakes. You will learn to pinpoint revenue leaks and churn indicators by building conversion and retention funnels in GA4. We will move from tracking user engagement to tracking money, calculating the direct financial cost of the friction points you find.