Introduction
In the last lesson, we built your 5-day audit playbook, a structured plan that turns your audit service into a marketable product. The very first step in that plan, on Day 0, is "Client Onboarding," which includes a crucial action: Send them your client-facing setup guide for Microsoft Clarity and Google Analytics.
This lesson is about creating that exact deliverable. Your learning outcome is to create a client-facing setup guide for key analytics tools (Clarity, Hotjar, GA4).
This guide is more than just technical instructions. It's a professional onboarding tool that accomplishes three things:
- Demonstrates Professionalism: It shows you have a refined process.
- Reduces Friction: It makes it easy for the client to give you what you need, saving time and back-and-forth emails.
- Adds Immediate Value: It includes best-practice configurations, showing your expertise before the audit even officially begins.
By the end of this 60-minute lesson, you will have a reusable, client-ready guide built in Figma that you can deploy for every new engagement.
1. Justifying Your Toolkit
Before you tell a client how to install something, you need to tell them why. A founder or PM will want to know why you've chosen these specific tools. Your guide should start with a concise explanation.
- Google Analytics 4 (GA4): This is the industry standard for quantitative web analytics. It answers "what," "where," and "how many."
- Microsoft Clarity: This is a free behavior analytics tool that provides heatmaps and session recordings. It answers "why." It shows you the user's struggle.
- Hotjar: A popular competitor to Clarity. We recommend Clarity because its free plan is far more generous, providing immense value at no cost to the client.
To make this point visually and effectively in your guide, you can use a simple comparison.

2. Building the Guide in Figma
Let's start building the deliverable. As per your preference, we will create this entire guide as a polished, professional document in Figma.
Action: Create the Template
- Open your main course Figma file.
- Create a new page and name it
[Asset] Analytics Setup Guide. - Create a frame (e.g., A4 or 1920x1080) to serve as a page in your guide. Title it "Analytics Setup for Your UX Audit."
- Create sections within this frame or on subsequent frames for:
1. Why We Use These Tools2. Microsoft Clarity Setup (~5 mins)3. Google Analytics 4 Setup (~10 mins)
In the first section, add the Clarity vs. Hotjar Feature Comparison image and a brief text summary explaining your tool choices.
3. Part 1: Microsoft Clarity Setup Guide
This section will walk the client through setting up Clarity and granting you access. The instructions should be simple, direct, and illustrated with clear steps.
First, let's review the process from the official source.
How to Setup Microsoft Clarity for Your Website
This short official video from Microsoft Clarity covers the entire setup process. We will extract the key steps for our guide.
Watch from 00:19 to 01:44. Pay attention to the three core steps: 1. Signing up, 2. Creating a project, and 3. Installing the tracking code. Note the two installation options: via a platform integration (like WordPress/Shopify) or manual code pasting.
Now, let's add the crucial step: how the client grants you access to their project.
How Cross-Functional Teams Can Collaborate in Microsoft Clarity
This article from the Microsoft Clarity blog explains how to manage team access. We need the client to add you as an 'Admin' so you can configure everything correctly.
Read the section 'Account Access Management'. Focus on the steps to invite a team member and the difference between 'Admin' and 'Member' roles.
Action: Populate the Clarity Section in Your Figma Guide
Based on the resources, add the following instructions to the "Microsoft Clarity Setup" section of your Figma guide. Phrase them as if you are speaking to your client.
Headline: Microsoft Clarity Setup (~5 mins)
Step 1: Create Your Account & Project
- Go to
clarity.microsoft.comand sign up using your Google or Microsoft account. - Click "New project" and enter your website's Name and URL.
Step 2: Install the Tracking Code
- If you use a platform like WordPress, Shopify, or Wix: Go to
Settings > Setupand click the "Integrations" tab. Follow the instructions for your platform. - For all other websites: On the
Setuppage, copy the tracking code. Send this code to your developer with the instruction: "Please paste this code into the<head>section of all pages on our website."
Step 3: Grant Me Access
- In your Clarity project, go to
Settings > Team. - Click "Add team member."
- Enter my email address:
[Your Email Address]. - Assign me the Admin role.
- Click "Add."
4. Part 2: Google Analytics 4 Setup Guide
This section is similar but slightly more complex. We need to guide the client through creating a GA4 property and, most importantly, granting you the correct level of access without giving away full control of their Google account.
First, let's understand the setup and installation.
Google Analytics 4 tutorial for beginners (2026 update) || GA4 tutorial for beginners || GA4 course
This comprehensive GA4 tutorial from Analytics Mania covers setup in detail. We'll focus on the initial creation and the critical configuration settings that will make your audit more powerful.
Please watch these three segments: Account & Property Setup (00:10 - 06:01): Understand the flow of creating an Account, Property, and Data Stream. This forms the core of your setup instructions. Installation Methods (06:01 - 11:40): Note the three ways to install GA4. The 'measurement ID' method is most common for clients. Crucial Configurations (57:20 - 01:02:49): Pay close attention to these five settings. We will include these in our guide as a value-add. Specifically note: increasing data retention to 14 months and defining internal traffic.
Next, let's master the process of getting access. This is the most important part for you as a consultant.
How to Share Google Analytics Access - GA4 User Roles Explained
This article, 'How to Share Google Analytics Access,' clearly explains the different roles and the process for granting access. We'll use this to write unambiguous instructions for the client.
Read these sections: 'User Roles in Google Analytics 4': Understand the difference between Viewer, Editor, and Administrator. 'How to Share Google Analytics Access: Step-by-Step': This is the exact process you'll put in your guide. Note the distinction between Account and Property level access. 'Extending Google Analytics Access to Third Parties': This frames the process from the perspective of you, the consultant.
Action: Populate the GA4 Section in Your Figma Guide
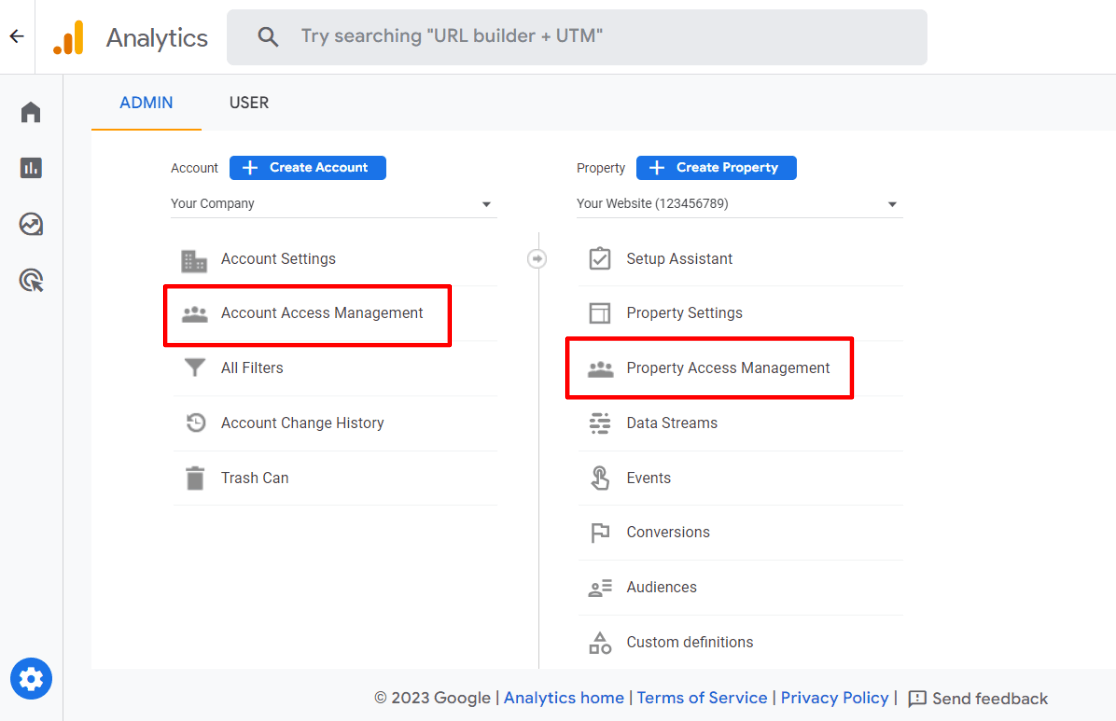
Use the video and article to build out the "Google Analytics 4 Setup" section. Use the following image to help your client locate the correct menu.
Headline: Google Analytics 4 Setup (~10 mins)
Step 1: Create a GA4 Property (if you don't have one)
- Go to
analytics.google.com. - Go to
Admin(gear icon, bottom-left). - Click
Create AccountorCreate Property. Follow the on-screen prompts to set up a new property for your website.
Step 2: Install GA4
- During setup, you will receive a Measurement ID (looks like
G-XXXXXXXXXX). - If you use a platform (WordPress, etc.): Most have a plugin or setting where you can paste this Measurement ID.
- Otherwise: Send the ID and installation instructions to your developer.
Step 3: Grant Me Access
- Go to
Admin>Propertycolumn >Property Access Management. - Click the blue
+icon and selectAdd users. - Enter my email:
[Your Email Address]. - Assign me the Editor role. This role allows me to configure reports and analyze data without giving me full administrative control.
- Click
Add.
Step 4: Best-Practice Configuration
Please make these two quick changes for more accurate data:
- Extend Data Retention: Go to
Admin > Data Settings > Data Retention. ChangeEvent data retentionfrom 2 months to 14 months and Save. - Exclude Office Traffic: Go to
Admin > Data Streams > [Your Web Stream] > Configure tag settings > Show more > Define internal traffic. Create a rule to exclude your office's IP address to avoid skewing data. (You can find your IP address by searching "what is my IP" on Google). Then go toData Settings > Data Filtersand activate the filter.
Conclusion
You have now created a critical, reusable asset for your consulting business. This client-facing setup guide, built professionally in Figma, streamlines your onboarding process and immediately establishes your credibility. You've taken a necessary but potentially tedious step and turned it into a value-add service.
Key Takeaways:
- A client-facing setup guide is a professional tool that reduces onboarding friction.
- Justify your tool choices to the client, focusing on value (e.g., Clarity's powerful free tier).
- Provide clear, step-by-step instructions for both tool installation and, crucially, granting you the correct level of access (Admin for Clarity, Editor for GA4).
- Add value by including best-practice configurations, such as extending data retention in GA4.
Preview of the Next Module:
With the tools set up and data flowing, we are ready to move to Module 2: Finding Money Leaks: Funnel & ROI Analysis. In the next lesson, we will dive into GA4 and use the access you've just been granted to build conversion funnels. You will learn how to pinpoint the exact steps in the user journey where the business is losing customers and, more importantly, losing money.