Introduction
In our last session, you mastered the technique of building signup and activation funnels to pinpoint user friction during onboarding. You now have a repeatable process for finding where users are struggling.
Today, we escalate from identifying friction to tracking money. This lesson is squarely focused on your learning outcome: to pinpoint revenue leaks and churn indicators by building conversion and retention funnels in GA4. We will move beyond engagement metrics to the data that your clients—founders and product managers—care about most: conversions and customer retention.
By the end of this 60-minute lesson, you will be able to construct two of the most powerful reports in a SaaS UX audit:
- A Conversion Funnel that tracks a user's journey from sign-up to the moment they pay.
- A Retention Report (Cohort Analysis) that shows you exactly when and why paying customers churn.
This is how you start to find the real money leaks.
1. From Activation to Conversion: Tracking the Path to Payment
In the last lesson, we tracked users until they performed a core value action (e.g., feature_used). Now, we follow them to the final step: paying for the service. This is the Conversion Funnel. Its sole purpose is to measure how effectively the product turns activated users into paying customers.
How to Track SaaS in Google Analytics
To build an effective conversion funnel, you need to know which events to track. This article outlines the key monetization events that form the final steps of the SaaS customer journey.
Review the sections on 'Monetization & Revenue Events' and 'Map the User Journey with a Funnel Exploration Report'. Focus on the events like upgrade_to_paid and purchase. These are the final conversions that define a revenue-generating funnel.
A typical SaaS Conversion Funnel might look like this:
- Step 1:
sign_up: The user has created an account. - Step 2:
tutorial_complete: The user has been onboarded. - Step 3:
core_feature_adoption: The user has experienced the "aha!" moment (e.g., an event likeinvoice_sent). - Step 4:
view_pricing_pageorupgrade_prompt_viewed: The user shows intent to upgrade. - Step 5:
purchaseorupgrade_to_paid: The user becomes a paying customer.
The drop-off between Step 4 and Step 5 is one of the most critical and financially significant leaks in any SaaS business. This is often where you'll find your first high-impact, quick-win recommendation.
2. Building and Analyzing the Conversion Funnel in GA4
You already have the core skills to build this from our last lesson. Now, we apply them to a monetization context.
[GA4] Funnel or path explorations: Which is best?
This video provides an excellent walkthrough of building a funnel using events, which is exactly what we need for a SaaS product. Pay close attention to how an e-commerce funnel is constructed; the principles are identical to building a SaaS conversion funnel.
Watch the following two segments: Building a Funnel with Events (10:50 - 15:45): The presenter builds a multi-step e-commerce funnel using events like view_item_list, add_to_cart, and purchase. Mentally substitute these with SaaS events like tutorial_complete, view_pricing_page, and upgrade_to_paid. Analyzing the Results (15:45 - 17:19): This is the crucial part. The presenter immediately identifies the biggest abandonment rate and hypothesizes the cause. This is the exact process you will follow.
Finding the Leak
Once your funnel is built, your task is to find the single biggest point of failure. The 'Abandonment rate' in the GA4 report tells you exactly where to look.
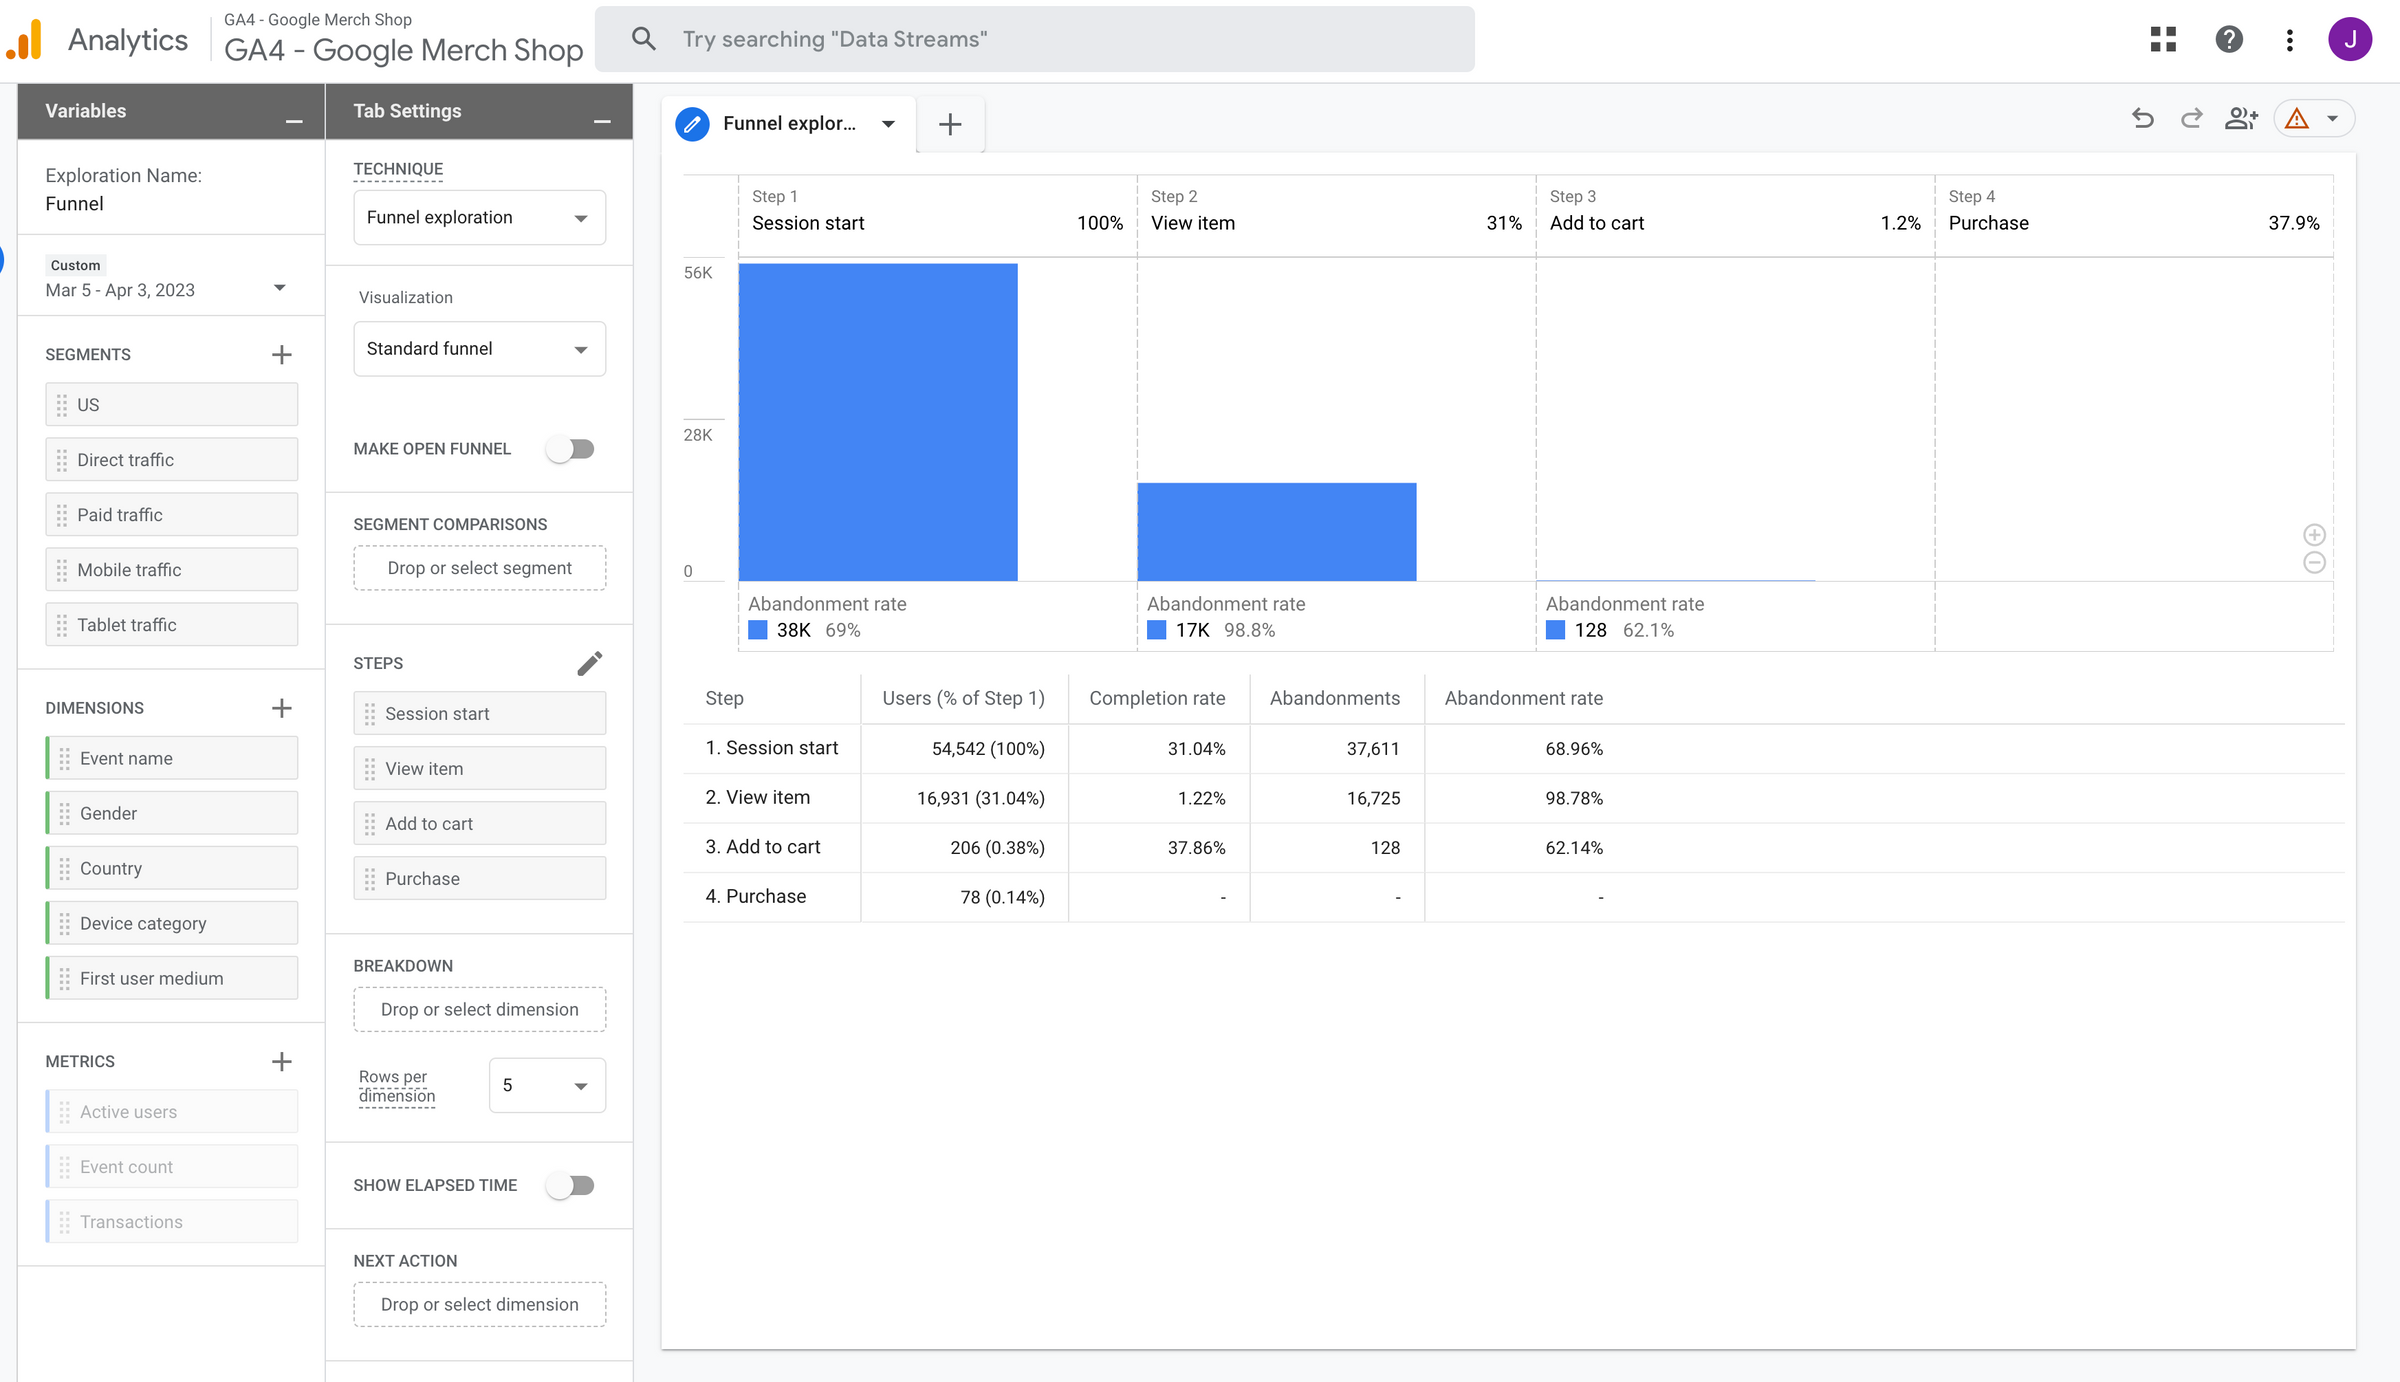
A key technique here is to isolate the users who dropped off. As shown in the next video, you can create a segment of these users for deeper analysis.
Funnel exploration in Google Analytics 4 | Funnel reports in GA4
Now, let's look at a specific tactic for analyzing the users who abandon the funnel.
Watch the segment on Interacting with the Funnel (04:56 - 06:05). Focus on how you can right-click on the drop-off bar to create a segment of users who abandoned. A client can use this segment for retargeting campaigns or for recruiting in future usability tests you might propose.
3. From Conversion to Retention: Identifying Churn with Cohort Analysis
Getting the first payment is only half the battle. For a subscription business, the real value is in retention. A high churn rate can kill a SaaS company, even if its conversion rates are good.
This is where Cohort Analysis comes in. Instead of a linear funnel, a cohort report groups users by when they signed up (e.g., "January Signups," "February Signups") and tracks what percentage of them remain active over time. It's the most effective tool for spotting when users lose interest and churn.
GA4 Cohort Analysis for SaaS Churn
This article is a concise, tactical guide to using GA4's Cohort Exploration report to measure and diagnose churn. It's the theoretical foundation for our next practical step.
Read the following sections to get up to speed quickly: 'What is Cohort Analysis?' and 'How GA4 Groups Users into Cohorts': Understand the basic concept. 'Main Cohort Tracking Numbers': Memorize these key metrics: Retention Rate and Churn Rate. 'How to Create GA4 Cohort Reports' and 'Measuring Churn with Cohorts': This provides the step-by-step process we will implement. Pay attention to the churn rate formula: Churn Rate = (Lost Customers / Starting Customers) x 100.
Building the Retention Report in GA4
- Navigate to Explore and select Cohort exploration.
- In the "Tab Settings," configure the following:
- Cohort inclusion: The event that defines the start of the user's life. Use the
sign_upevent. - Return criteria: The event that proves the user is still active.
loginis a good starting point, but a core action likefeature_usedis even better. - Cohort granularity: Set to
Weeklyto analyze early-stage churn, orMonthlyfor long-term trends. - Calculation:
User retention.
- Cohort inclusion: The event that defines the start of the user's life. Use the
The report will generate a table. Each row is a cohort (e.g., users who signed up the week of Oct 1). Each column shows the percentage of that cohort that was still active in Week 1, Week 2, Week 3, and so on.
A healthy SaaS product has a retention curve that flattens out over time. A "leaky bucket" SaaS has a curve that continually drops towards zero. A sudden, steep drop is a critical churn indicator. For example, if you see retention plummet in Week 4, it's a massive signal that the trial-to-paid experience is failing or the product isn't delivering on its initial promise.
Action: Create Your Revenue Leak Worksheet
As with our last lesson, your deliverable is a practical, reusable asset. Create a new Frame in your Figma project titled "Revenue Leak Analysis." This will be the evidence file for the most critical findings in your audit.
Part 1: Conversion Funnel Analysis
- Funnel: Trial-to-Paid Conversion
- Goal: Measure the percentage of activated users who successfully upgrade to a paid plan.
- Funnel Steps: List the events from
sign_uptopurchase. - Screenshot: Insert a screenshot of your GA4 conversion funnel report.
- Primary Leak Point:
- Observation: (e.g., "There is a 78% abandonment rate between viewing the upgrade modal and completing the purchase.")
- Hypothesis: (e.g., "The pricing tiers are confusing, or the payment form has significant usability friction.")
Part 2: Retention & Churn Analysis
- Report: Weekly User Retention Cohort
- Goal: Measure week-over-week retention of new signups to identify when users become inactive.
- Screenshot: Insert a screenshot of your GA4 cohort exploration report.
- Primary Churn Point:
- Observation: (e.g., "User retention drops from 45% in Week 1 to 15% in Week 2, a 66% relative drop.")
- Hypothesis: (e.g., "Users are not discovering the core value ('aha!' moment) within their first week, so they see no reason to return.")
This worksheet moves your analysis from "users are having trouble" to "the business is losing customers at this specific point."
Conclusion
You have now moved up the value chain. You are no longer just identifying usability issues; you are pinpointing the exact locations where a business is losing money and customers.
Key Takeaways:
- The Conversion Funnel (
sign_uptopurchase) quantifies the effectiveness of your client's monetization strategy. - Cohort Analysis is the definitive tool for measuring user retention and identifying the timing of churn.
- A steep drop-off in the conversion funnel is a revenue leak. A steep drop-off in the cohort report is a churn indicator. Both are high-priority business problems.
Preview of the Next Lesson:
You've successfully located the leaks. In our next session, we will quantify their financial impact. You will learn to calculate the monthly revenue loss from a specific funnel drop-off and estimate the potential support cost savings from fixing usability issues. We will build a financial impact calculator that turns your UX findings into a compelling, data-driven business case—the final piece you need to justify a $5k audit fee.