Introduction
In our last lesson, you pinpointed where a SaaS business is losing customers by analyzing conversion and retention funnels. You now know how to find the leaks. Today, we attach a price tag to them.
This lesson is laser-focused on a single, high-leverage skill: calculating the monthly revenue leakage from a specific funnel drop-off point. This isn't just an academic exercise; it's the core calculation that transforms your UX audit from a set of "nice-to-have" suggestions into an urgent business case that justifies your $5,000 fee. You're not selling design; you're selling ROI.
By the end of this session, you will have a repeatable formula to calculate exactly how much money a client is losing each month from a single weak point in their user experience.
1. From Drop-off Percentage to Dollars and Cents
In your "Revenue Leak Analysis" worksheet, you identified drop-off points like this one:
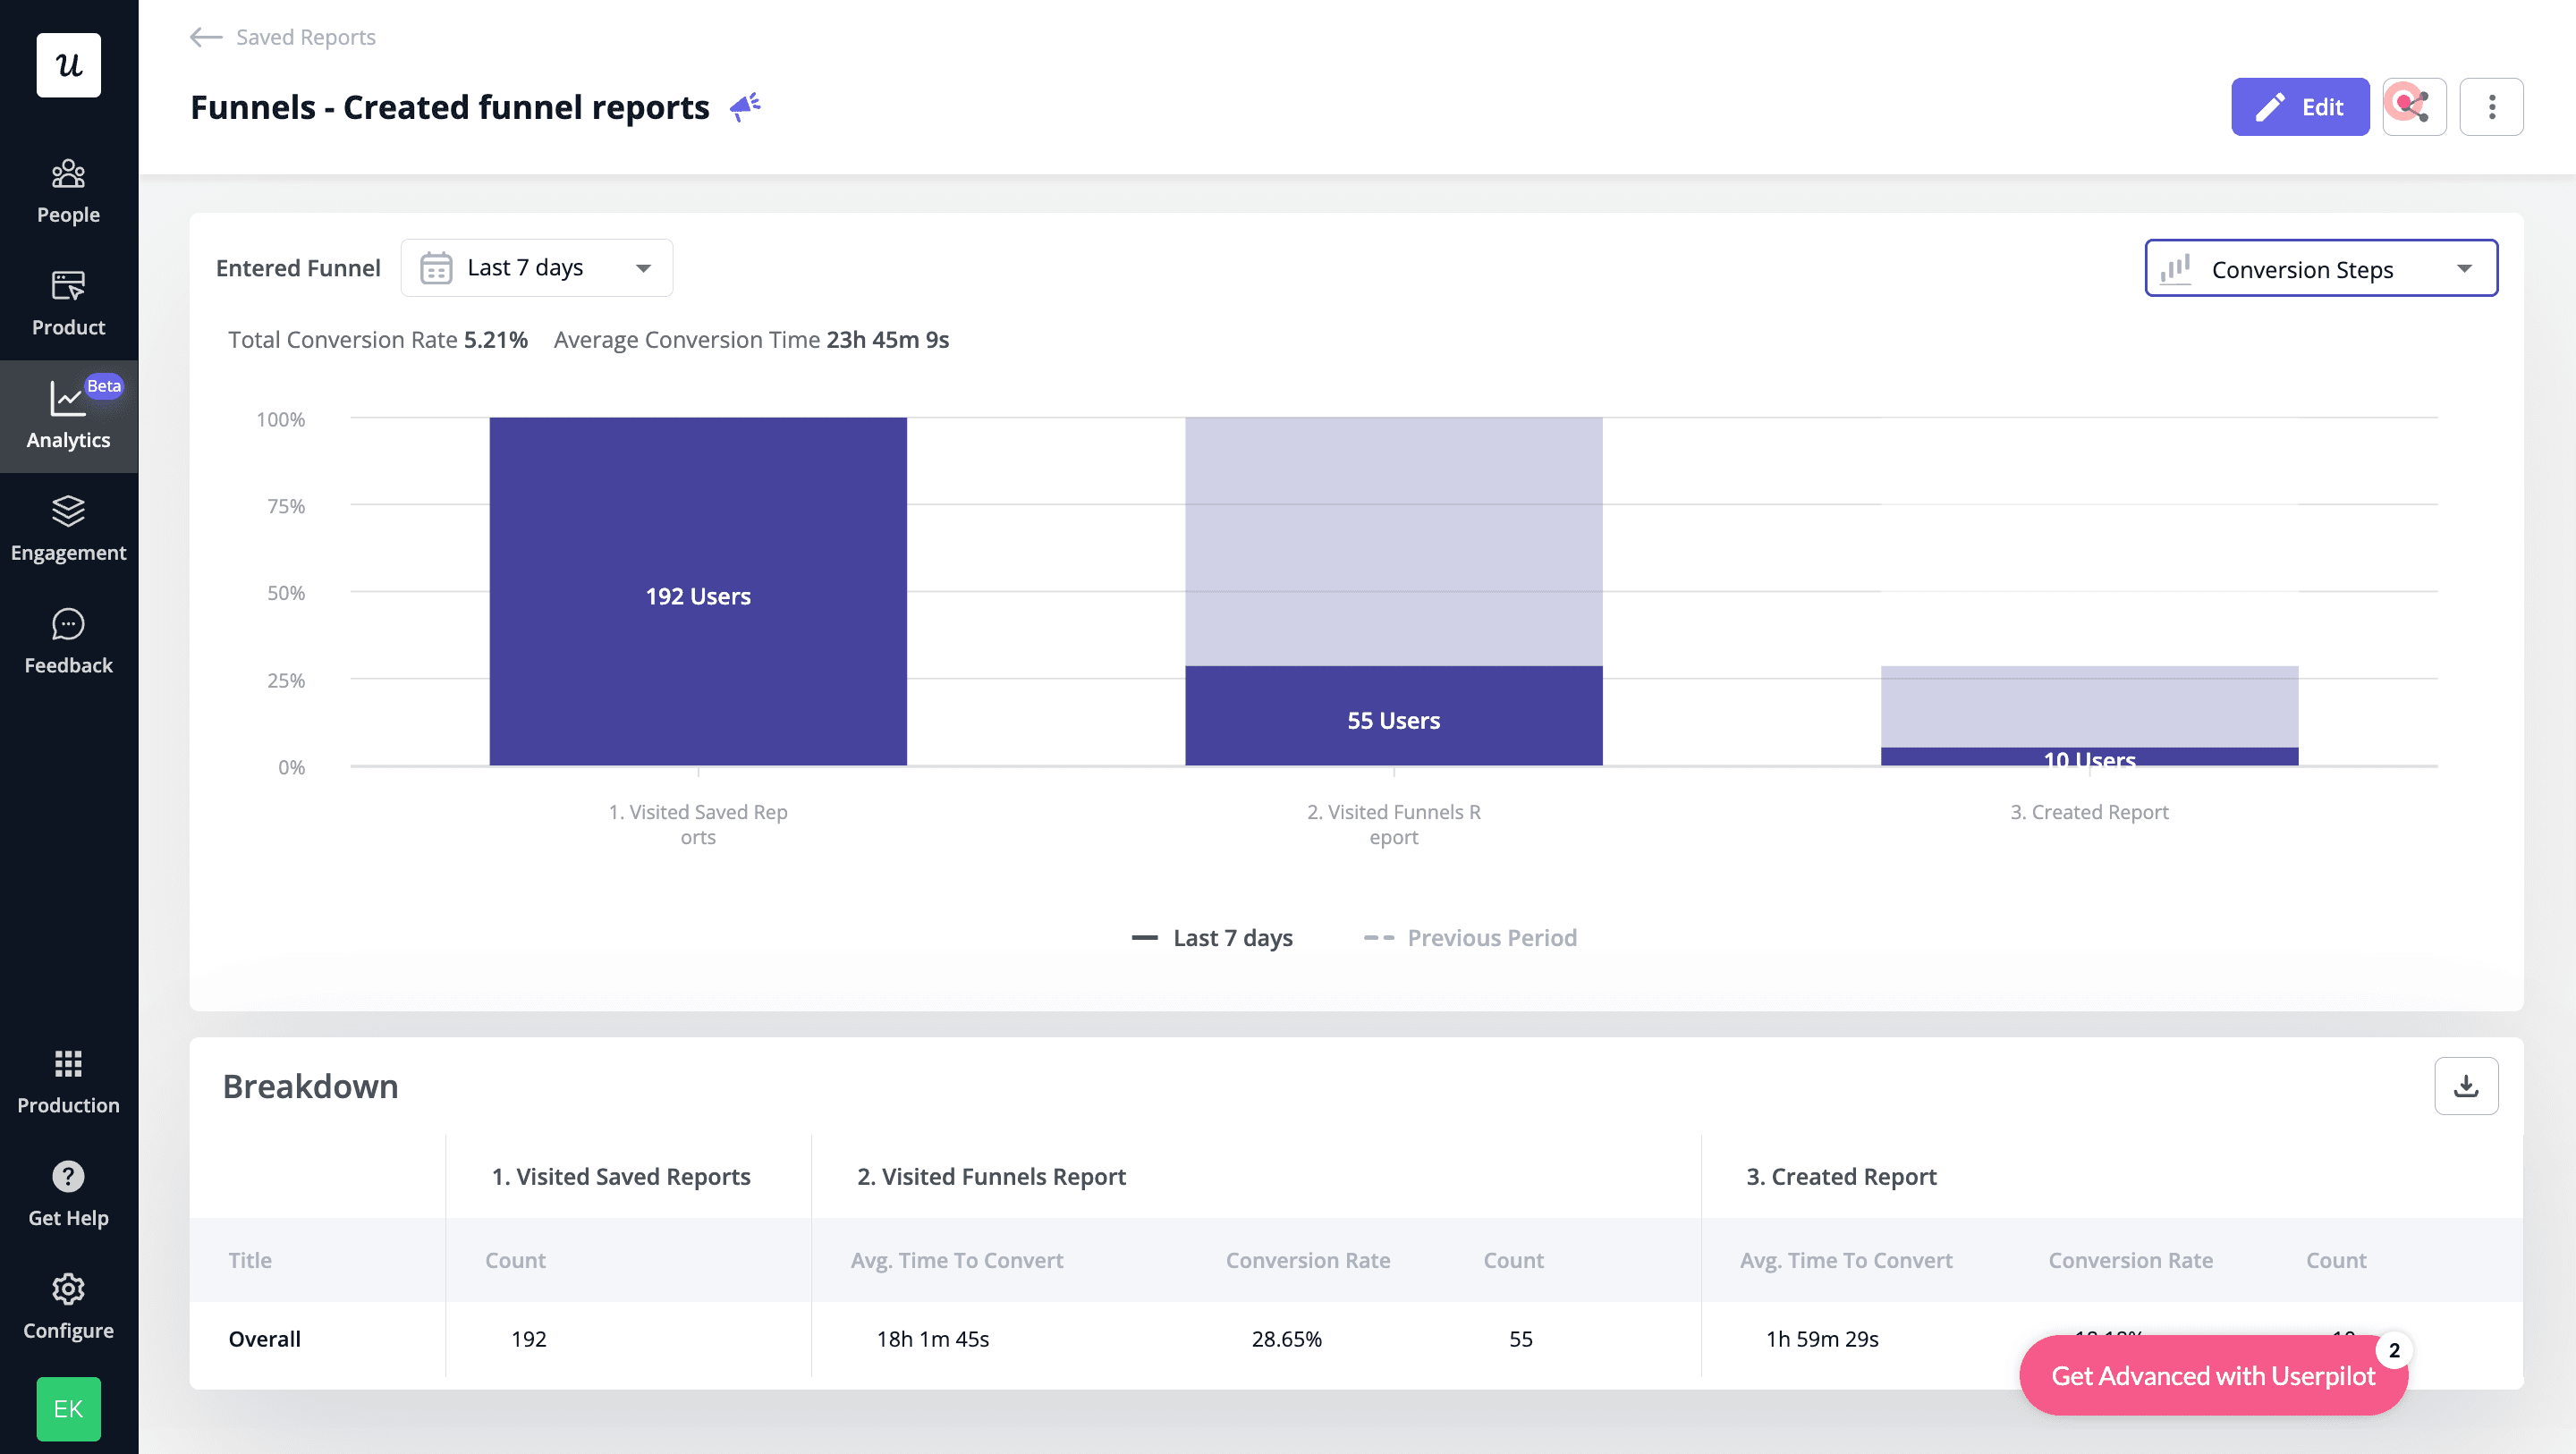
A drop-off percentage is a diagnostic symptom. A dollar amount is a business problem. We're going to use a simple but powerful formula to bridge that gap.
To start, let's look at a straightforward example of how small conversion improvements create significant revenue growth.
The Revenue Impact of Conversion Optimization
This article, 'How to Conduct a CRO Audit That Increases Conversions by 40%+', opens with a perfect, concise calculation showing the direct link between conversion rate and monthly revenue. This is the principle we'll be applying.
Read only the introductory section, 'The Revenue Impact of Conversion Optimization'. Note how a 1.5% increase in the trial conversion rate results in a 50% increase in monthly revenue. Internalize this concept: small UX fixes yield large financial returns.
2. The Revenue Leakage Formula
Now for the core of today's lesson. We will use a specific formula to calculate the potential revenue gain from fixing a funnel leak. You can frame this to a client as either "monthly revenue we can unlock" or "monthly revenue currently being lost."
The most effective way to calculate this is to project a realistic improvement, not to assume you can capture 100% of the dropped users.
Calculate Your UX ROI in 3 Steps
The article 'UX ROI: Proven Revenue Impact' provides the exact formula and a clear example of this calculation. This is the engine of your financial justification.
Focus entirely on the section 'Step 3: Calculate Revenue Impact'. Study the formula and the example table. This is the exact methodology you will be using for your deliverable.
Let's deconstruct the formula from the article into a process you can apply directly.
The Formula to Calculate Monthly Revenue Leakage (or Potential Gain):
Let's break down the components:
- Old CR (Current Conversion Rate): The percentage of users who successfully complete the step you're analyzing. You get this directly from GA4.
- New CR (Target Conversion Rate): Your projected conversion rate after your proposed UX fixes are implemented. This is a crucial assumption. You must be prepared to defend it. A good starting point is to aim for a conservative improvement (e.g., from 15% to 20%, not 15% to 80%). You can justify it with industry benchmarks or case studies of similar fixes.
- Monthly Traffic at Step: The number of users entering the specific funnel step each month. Also from GA4.
- Value per Conversion: What a single successful conversion is worth. For a SaaS product, this is typically the Average Revenue Per User (ARPU) or the Lifetime Value (LTV). For e-commerce, it's the Average Order Value (AOV). You will have to ask the client for this number.
This formula is powerful because it's grounded in the client's own data and hinges on a single, debatable assumption (the New CR) which you can present conservatively.
3. Case Study: How a "Small" Fix Creates a Huge Win
Before you apply this yourself, it's critical to see what a successful outcome looks like. You're not just improving a conversion rate; you're increasing revenue per user.
CRO Audit - A Real Example of How to Perform a CRO Audit of Your Website
This video shows a real-world example from a CRO audit where a redesign of a product page led to a massive revenue increase. This is the 'after' picture you're selling to your clients.
Watch the segment from 17:50 to 19:45. The presenter analyzes a split test result. Notice his language: he dismisses the conversion rate lift as secondary to the primary metric: a 19% lift in Revenue Per User, which resulted in 26% higher overall revenue. This is the mindset you need to adopt.
The key takeaway is that your goal is not to make the interface prettier; it is to make the business more money. The calculation you are about to perform is the first step in proving you can do that.
Action: Calculate the Financial Impact in Figma
It's time to put this into practice. Go to your Figma project and the "Revenue Leak Analysis" frame you created in the last lesson.
For the "Primary Leak Point" you identified, you will now add a financial calculation. If you don't have real data, use the following realistic scenario. The process is what matters.
Scenario: A SaaS product's Pricing Page -> Purchase funnel step.
- Create a new section in your Figma frame titled "Financial Impact of Primary Leak."
- Structure your analysis exactly as follows, filling in the numbers from the scenario:
1. Funnel Step Analysis
- Leaking Step:
View Pricing Page→Purchase
2. Key Metrics (From GA4 & Client)
- Monthly Traffic at Step (
View Pricing Page): 4,200 users - Users Completing Step (
Purchase): 210 users - Value per Conversion (Monthly ARPU): $49
- Current Conversion Rate (Old CR):
210 / 4200 = 5%
3. Target & Justification
- Target Conversion Rate (New CR): 8%
- Justification: The current conversion rate of 5% is below the industry average of 7-10% for this stage. A UX overhaul of the pricing page, clarifying the value proposition and simplifying the checkout form, can conservatively lift the CR by 3 percentage points. This is a realistic target.
4. Monthly Revenue Leakage Calculation
- CR Improvement:
New CR - Old CR = 8% - 5% = 3% - Additional Monthly Customers:
Monthly Traffic × CR Improvement = 4200 × 3% = 126 - Monthly Revenue Leakage:
Additional Customers × ARPU = 126 × $49 = $6,174
5. Business Impact Summary
- Conclusion: The friction in the checkout funnel is causing an estimated revenue leak of $6,174 per month.
- Annualized Impact: This represents a loss of $74,088 per year.
This structured breakdown is now a reusable asset. You can duplicate this layout for every audit you perform. It's clear, defensible, and frames the UX problem in the language that founders and product managers understand: lost revenue.
Conclusion
Today, you've acquired your most important sales tool. You've moved beyond identifying problems to quantifying their financial cost. This calculation is the foundation of a value-based argument for your fee.
Key Takeaways:
- Don't just report drop-off percentages; translate them into monthly revenue leakage.
- The formula
(New CR - Old CR) × Traffic × Valueis your key to quantifying financial impact. - Always base your "New CR" target on a conservative, defensible assumption.
- Frame the result in terms of monthly and annualized revenue loss to create urgency.
Preview of the Next Lesson:
Revenue leakage is only one side of the ROI coin. Many UX issues don't directly block a purchase but create friction that floods customer support, costing the company money every day. In our next lesson, you will learn to estimate potential support cost savings from fixing a critical usability issue. By combining revenue gain and cost savings, you will build a complete and undeniable financial case for your work.