Recommended resources
The freely available resources this lesson will direct you to.
- OpenTelemetry: How distributed tracing really works with Python, FastAPI and requestswww.youtube.com
- A practical guide to using OpenTelemetry in Python by Tom Eastman.www.youtube.com
- Add and modify Azure Monitor OpenTelemetry for .NET, ...learn.microsoft.com
- Enable OpenTelemetry in Application Insights - Azure Monitorlearn.microsoft.com
Hello. The previous lesson gave you a way to release new Container Apps revisions and check whether their endpoints respond. A successful HTTP check is valuable, but it cannot tell you why a request was slow or whether failures are becoming more frequent. This lesson adds OpenTelemetry to the FastAPI backend and sends request telemetry, a request counter, and exception information to Application Insights.
Allow about 45–55 minutes, including the readings and a short validation run. We will instrument the existing backend, not replace its application code or add a separate monitoring service.
What the backend will report
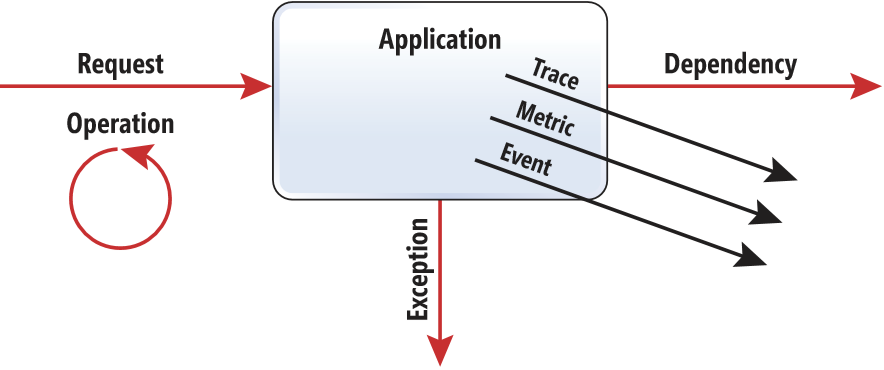
OpenTelemetry describes three useful kinds of evidence. A trace follows one operation through its spans; a server-request span can show how long a particular API call took. A metric is a numerical measurement you can aggregate, such as completed requests per interval. An exception record helps explain a failure. Application Insights receives and presents that telemetry; OpenTelemetry is the instrumentation used inside the application.
The diagram below distinguishes browser activity, server requests, and calls to dependencies. Our scope here is the server-side FastAPI application. Adding its instrumentation does not automatically instrument the React browser code.
Microsoft Learn’s Enable OpenTelemetry in Application Insights provides the Python installation and connection-string procedure. Read its Python instructions rather than the alternative language examples:
Enable OpenTelemetry in Application Insights - Azure Monitor
Read Microsoft Learn’s setup guide to see which Python package sends telemetry to Application Insights and how the application obtains its destination.
Under “Install the client library,” find the Python pip install azure-monitor-opentelemetry command and read the surrounding installation guidance. Under “Modify your application,” locate the Python configure_azure_monitor() example. Then read connection and verification across “Copy the connection string from your Application Insights resource,” “Paste the connection string in your environment,” and “Confirm data is flowing.” Focus on the production recommendation to use an environment variable and on the fact that results may take a few minutes to appear.
The connection string identifies the telemetry destination; it is not a database password or an Azure login credential. Nevertheless, avoid committing it to the repository or printing it in CI logs. Telemetry itself also needs care: exception messages and request attributes can contain data you did not intend to retain. Do not attach credentials, request bodies, user identifiers, or raw URL query strings to custom spans or metrics.
Prepare an inexpensive destination
Application Insights needs an Azure resource to receive the backend’s telemetry. For this lab, use a workspace-based Application Insights resource and a Log Analytics workspace. If an appropriate workspace already exists, reuse it rather than creating another. The resource group and region choices should follow the deployment decisions you made earlier in the course.
If Terraform owns these resources, the essential configuration is:
# Adapt resource-group references and names to your existing configuration.
# Omit this resource if you are reusing an appropriate workspace.
resource "azurerm_log_analytics_workspace" "telemetry" {
  name                = var.telemetry_workspace_name
  location            = azurerm_resource_group.lab.location
  resource_group_name = azurerm_resource_group.lab.name
  sku                 = "PerGB2018"
  retention_in_days   = 30
}

resource "azurerm_application_insights" "backend" {
  name                = var.telemetry_app_name
  location            = azurerm_resource_group.lab.location
  resource_group_name = azurerm_resource_group.lab.name
  application_type    = "web"
  workspace_id        = azurerm_log_analytics_workspace.telemetry.id
}
If you reuse a workspace, change workspace_id to reference that existing workspace instead. Declare the two name variables using the same variable-file pattern as your earlier Terraform labs. Review terraform plan before applying: the plan should add only the intended monitoring resources, not replace your backend, database, or currently serving revisions. The Application Insights connection string will be available on the resource’s Overview page, as described in the reading.
Cost before provisioning: reviewing documentation, editing Terraform, and running terraform plan do not add Azure usage. Cost after provisioning: Application Insights and its workspace can incur charges for telemetry ingestion and retention; any existing Container Apps, PostgreSQL, ACR, or AKS resources continue to incur their own charges. There is no reliable fixed price for this lab because request volume, log volume, retention, region, and existing resources differ. Check the applicable prices and your Azure budget before applying. Keep the test brief, inspect ingestion afterward, and remove lab-only monitoring resources when you finish. A budget alert warns you about spending; it is not a hard spending limit.
Instrument the existing FastAPI application
Install the Azure Monitor OpenTelemetry distribution in the backend’s dependency set and rebuild its image through your normal process:
pip install azure-monitor-opentelemetry
Record the resolved version using your existing requirements or lockfile workflow so CI builds the same dependency. The distribution configures Azure Monitor export and supported automatic instrumentation. Do not also call a FastAPI instrumentor’s instrument() method alongside configure_azure_monitor(); duplicate instrumentation can produce confusing or duplicated telemetry.
At the beginning of the module that creates your FastAPI application—before importing FastAPI and other modules you want automatically instrumented—add:
import os

if os.getenv("APPLICATIONINSIGHTS_CONNECTION_STRING"):
    from azure.monitor.opentelemetry import configure_azure_monitor

    configure_azure_monitor(logger_name="backend")
Keep your existing FastAPI() instance, routes, database configuration, and health endpoints below this initialization. The backend logger namespace limits which of your application’s Python logging calls the configuration collects; it does not disable request tracing. If the connection string is absent, the backend can still start for local development and ordinary tests without exporting Azure telemetry. Ensure a test runner does not inadvertently inherit a real connection string.
Automatic server-request telemetry is a useful starting point. To make an explicit OpenTelemetry request metric as well, add the following to the same application module after your existing app = FastAPI(...) line. If you already have middleware, integrate this into it rather than counting each request twice.
from fastapi import Request
from opentelemetry import metrics

meter = metrics.get_meter("backend.http")
completed_requests = meter.create_counter(
    "backend_http_requests",
    unit="1",
    description="Completed backend HTTP requests",
)

@app.middleware("http")
async def count_completed_requests(request: Request, call_next):
    method = (
        request.method
        if request.method in {"GET", "POST", "PUT", "PATCH", "DELETE"}
        else "OTHER"
    )

    try:
        response = await call_next(request)
    except Exception:
        completed_requests.add(
            1,
            {"method": method, "status_class": "5xx"},
        )
        raise

    completed_requests.add(
        1,
        {
            "method": method,
            "status_class": f"{response.status_code // 100}xx",
        },
    )
    return response
The metric increments once when middleware completes a request, including a request that raises an exception. Its dimensions are deliberately small and bounded. Using each complete URL as a dimension would create many distinct metric series—and could expose values in URL paths. This counter is additional to the request information Application Insights derives from server telemetry; when exploring data, do not sum both as though they were independent traffic.
For exceptions, distinguish two cases. An exception allowed to propagate through an instrumented operation can be recorded with its trace. If your code catches and handles an exception, there may be no failed HTTP response; record it on an appropriate span when that handled failure is operationally important. Microsoft Learn shows both automatically recorded Python exceptions and span.record_exception() for manual recording:
Add and modify Azure Monitor OpenTelemetry for .NET, ...
Read the Python examples in Microsoft Learn to connect the counter and exception behavior above with OpenTelemetry’s APIs. Skip the other language examples.
In “Collect custom telemetry,” go to “Counter example” and find the Python example beginning near the counter code; compare its add() dimensions with the bounded dimensions used here. In the exception guidance immediately before “Add custom spans,” read the Python examples, noting the difference between an exception raised inside a span and one recorded manually. Finally, in “Add custom spans,” read the Python start_as_current_span() example to see how you could later bracket an application-specific operation.
You do not need a custom span around every FastAPI route: automatic request instrumentation already supplies the request boundary. Add a span later only where it answers a specific diagnostic question, such as how long an important backend operation took. Avoid logging an exception manually and recording it again automatically on the same span.
Cost of this step: installing and editing code locally does not create Azure usage. Once an instrumented backend sends telemetry, ingestion and retention can cost money; health-probe traffic and repeated test requests also generate telemetry. Keep the validation run short rather than generating a large load test.
Give the deployed backend its connection string
Set APPLICATIONINSIGHTS_CONNECTION_STRING on the backend Container App, not the frontend. In the existing Terraform-managed backend resource, add an environment-variable entry to its application container, adapting the references to your resource names:
env {
  name  = "APPLICATIONINSIGHTS_CONNECTION_STRING"
  value = azurerm_application_insights.backend.connection_string
}
This is an addition inside your existing container definition, not a second Container App resource. If the Application Insights resource or workspace already exists outside that Terraform configuration, obtain its connection string using your established configuration procedure instead; do not paste it into a committed .tfvars file.
Treat this as a deployment change. Updating a Container App’s revision-scoped template may create a new revision. The previous lesson’s release workflow owns images and traffic, while Terraform owns stable application configuration: inspect the plan and coordinate the change so an apply does not reset a released image or alter the explicit 100%-traffic rule. Check the candidate revision before assigning it production traffic. For AKS, the same backend code can be reused, but its environment-variable delivery belongs in that deployment’s existing configuration.
Cost of deployment: a new active revision can add Container Apps compute while it coexists with the old revision. A rebuild and release can consume GitHub runner minutes and ACR storage; the database and other retained infrastructure continue charging. Check the budget and deactivate unneeded revisions after validation. Do not leave a second revision running merely to collect more telemetry.
Validate requests, a metric, and a failure
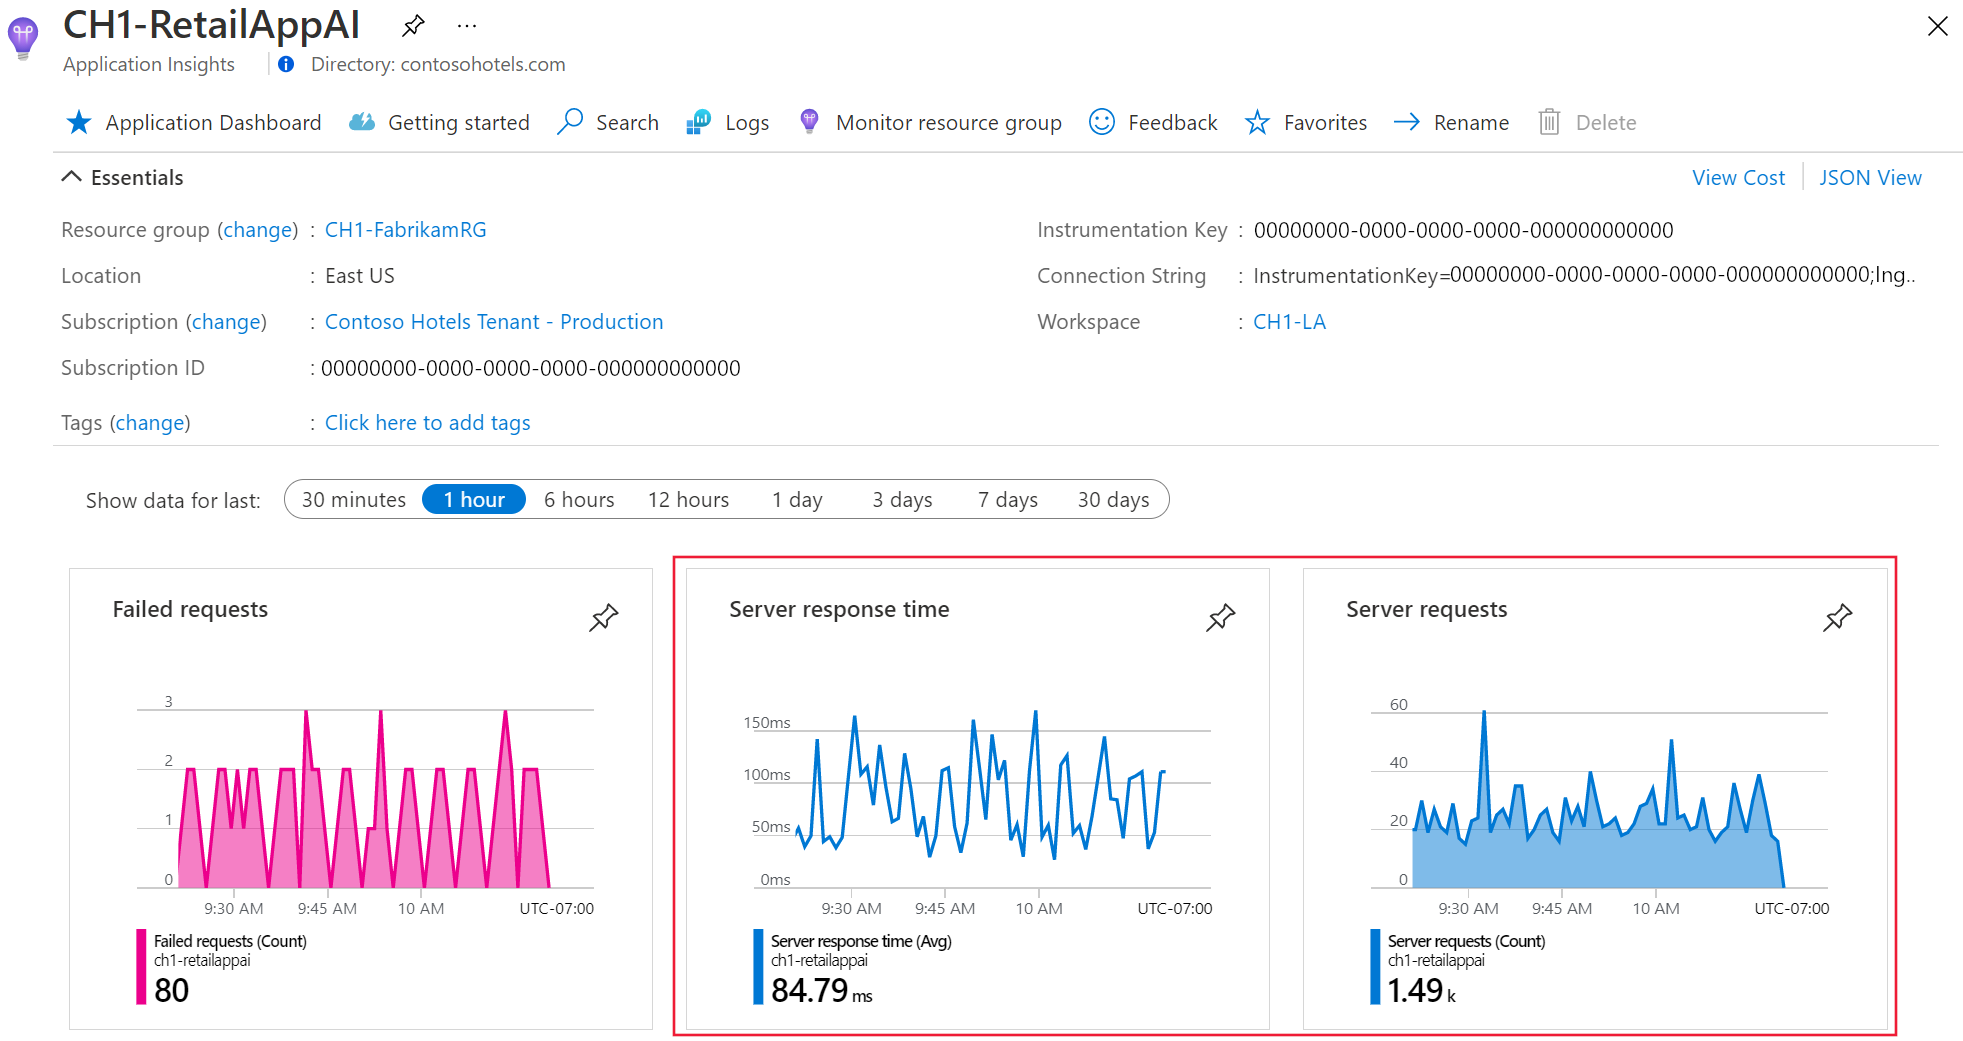
First, use the backend’s existing safe, read-only REST path. Make a few requests to the instrumented revision and allow several minutes for telemetry to arrive. In Application Insights Overview, look for server requests and response time. The example dashboard below shows the kind of request and failure trends to look for; your values will differ.
For more precise inspection, open Logs from the Application Insights resource. The following queries use its application-oriented table names:
requests
| where timestamp > ago(30m)
| project timestamp, name, resultCode, success, duration, operation_Id
| order by timestamp desc
| take 20
customMetrics
| where timestamp > ago(30m)
| where name == "backend_http_requests"
| project timestamp, name, value, customDimensions
| order by timestamp desc
| take 20
The counter might appear as aggregated metric data rather than one row per HTTP request. Inspect its dimensions and time window before comparing it with the requests table.
To generate a real exception without publishing a deliberate failure endpoint, use a temporary local-only test. Add this route below your existing application definition, run the backend bound to 127.0.0.1, and remove the route before committing or rebuilding an image:
# Temporary local test only; remove before committing.
if os.getenv("TELEMETRY_LAB_MODE") == "1":
    from opentelemetry import trace

    @app.get("/__telemetry_fail")
    async def telemetry_fail():
        tracer = trace.get_tracer("backend.lab")
        with tracer.start_as_current_span("synthetic.failure"):
            raise RuntimeError("Synthetic telemetry failure")
For this local test, obtain the connection string from the Application Insights Overview page. In a Bash shell, enter it without echoing the value or placing it in a command-line argument:
read -r -s -p "Application Insights connection string: " APPLICATIONINSIGHTS_CONNECTION_STRING
echo
export APPLICATIONINSIGHTS_CONNECTION_STRING
export TELEMETRY_LAB_MODE=1
Start your existing backend entry point on 127.0.0.1 using its normal local settings, request http://127.0.0.1:8000/__telemetry_fail once, then stop it. Use your actual local port if different. Never set TELEMETRY_LAB_MODE=1 on a public deployment. Remove the temporary route and unset the lab variable when finished.
After a few minutes, inspect the failed request and exception:
requests
| where timestamp > ago(30m)
| where success == false
| project timestamp, name, resultCode, operation_Id
| order by timestamp desc
exceptions
| where timestamp > ago(30m)
| project timestamp, type, outerMessage, operation_Id
| order by timestamp desc
A shared operation_Id helps associate the exception with its request. If requests appear but the exception does not, check the time range, whether the local test actually had the connection string, and whether the exception span was exported before the process stopped. If nothing appears, check the backend’s startup logs for instrumentation or export errors and confirm the connection string belongs to the Application Insights resource you are viewing. A missing result immediately after a request is not conclusive; ingestion may take a few minutes.
Cost of validation: a handful of local and deployed requests produces a small amount of potentially billable telemetry, but no safe fixed dollar figure applies. Do not run a traffic generator for this check. Inspect the workspace’s ingestion and your budget afterward; retention and ongoing health-probe telemetry can continue accumulating after you stop testing.
Key takeaways
Your FastAPI backend now has three complementary views in Application Insights: server-request telemetry for individual calls and response-time trends, a bounded OpenTelemetry counter for completed requests, and exception information for diagnosing failures. The connection string belongs in deployment configuration, while the telemetry’s contents and volume need the same deliberate review as any other operational data.
Next, you will use application telemetry alongside container-platform signals to create and validate an Azure Monitor alert.