Recommended resources
The freely available resources this lesson will direct you to.
- Functionality and Usage of Azure Monitor - AZ-900 Certification Coursewww.youtube.com
- Azure Application Insights Tutorial | Amazing telemetry servicewww.youtube.com
- Set up alerts in Azure Container Apps | Microsoft Learnlearn.microsoft.com
- Create Azure Monitor log search alert rules - Azure Monitor | Microsoft Learnlearn.microsoft.com
Hello. In the previous lesson, you sent FastAPI request and failure telemetry to Application Insights and checked it in Logs. Now you can turn that evidence into an operational response: an Azure Monitor alert that fires when a condition is met. You will create one alert from application requests and another from a built-in Azure Container Apps metric, then validate both without generating substantial traffic.
Allow about 45–55 minutes, including the readings and brief tests. This lesson uses the Azure portal so you can inspect each signal and its alert behavior before deciding whether to manage the rules with Terraform.
From telemetry to an alert
A chart shows you what happened when you look at it. An alert rule checks a signal on a schedule. The rule specifies the resource to monitor, the signal, and the condition that constitutes a problem. When that condition is met, Azure Monitor creates a fired alert. An action group can then send a notification; creating an alert does not, by itself, guarantee an email.
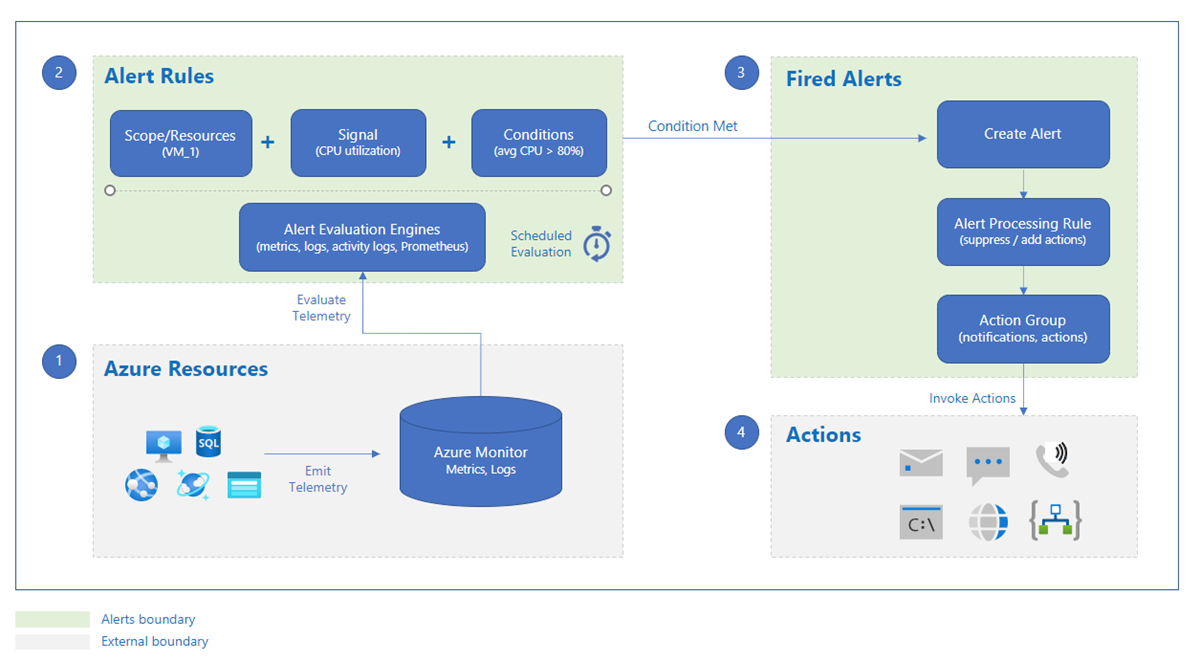
Your two rules will observe different layers:
- An application log alert will query request records sent by your instrumented FastAPI backend to Application Insights. Its lab condition will detect a deliberately requested, nonexistent path.
- A platform metric alert will evaluate a metric emitted for the backend Container App. It does not depend on the FastAPI OpenTelemetry code.
That distinction matters during diagnosis. If the platform receives requests but Application Insights records none, you may have a telemetry-export problem rather than an absence of traffic.
Cost before you begin: viewing existing metrics and logs and editing queries does not provision a new service, although retained application telemetry and existing infrastructure may continue to incur charges. Creating enabled alert rules can incur alerting charges, which depend on rule type, evaluation frequency, and—in some configurations—the number of monitored series. Notifications and telemetry ingestion may also affect cost. Check the prices and the portal’s Review + create details against your remaining monthly budget before creating either rule. A budget alert is a warning, not a spending cap.
Build an application alert from a query
Start with a condition you can trigger harmlessly. A GET request to a path that does not exist should produce a 404 request record without adding a failure endpoint or changing your deployed code. A 404 alert is useful for validating the alert pipeline, but a single 404 would generally be too noisy as a permanent production alert.
Read Microsoft Learn’s Create Azure Monitor log search alert rules for how the query becomes an alert condition:
Create Azure Monitor log search alert rules - Azure Monitor | Microsoft Learn
Read Microsoft's guide for the relationship between a KQL query, the number measured, the time window, and the evaluation frequency.
In "Configure the scope of the alert rule" and "Configure alert rule conditions," locate the instructions for selecting a resource and Custom log search. Within the latter section, read query and preview, beginning at the Logs pane and ending just after "Continue Editing Alert." Then, under "Measurement," "Split by dimensions," and "Alert logic," read condition settings. Focus on Table rows, aggregation granularity, static thresholds, and frequency. You do not need dimension splitting for this lab.
Open Logs from the Application Insights resource used by your backend, as you did previously. Confirm that recent backend requests appear with this query:
requests
| where timestamp > ago(30m)
| project timestamp, name, resultCode, success
| order by timestamp desc
| take 20
If no requests appear, send one ordinary request to your deployed backend and check again after allowing time for ingestion. Do not create an alert until you know that this is the Application Insights resource receiving its telemetry.
Next, run the prospective lab alert query:
requests
| where resultCode == "404"
In the Logs interface, choose a recent time range. For the alert itself, leave the query without an explicit time filter: the rule’s aggregation granularity will define the evaluation window. This query returns individual matching rows, so the rule can measure Table rows rather than calculating a numeric column.
Create the rule from Logs with New alert rule. Keep the scope on this backend’s Application Insights resource and the condition on Custom log search. Use these lab settings:
| Setting | Lab choice | Reason |
|---|---|---|
| Measure | Table rows | Each matching request is one returned row. |
| Aggregation granularity | 10 minutes | Gives ingested requests a short window in which to be evaluated. |
| Threshold | Static; greater than 0 | One matching 404 is sufficient for this test. |
| Frequency of evaluation | 5 minutes | Avoids the more frequent checks unnecessary for this lab. |
| Split by dimensions | Off | One backend alert is enough; splitting creates separate alert instances. |
The portal may display the measurement fields in a different order. Check that the preview reflects the intended query and condition before continuing. Give the rule a descriptive name such as lab-backend-404, and record in its description that it is a temporary validation rule.
Avoid splitting this log alert by request path or operation ID. A dimension that changes for every request can produce many distinct alert instances and potentially higher cost. If you later need separate alerts for a small, stable set of services, add dimensions deliberately.
Cost of this practical step: running a few queries against the existing telemetry should be brief, but creating the enabled log alert can introduce recurring alert charges, and its evaluations and underlying telemetry may be billable. Check the displayed configuration and current pricing before selecting Create.
Add a container-platform signal
The backend can also have a platform problem that is not best detected by an application query—for example, a change in resource usage or replica behavior. Azure Container Apps exposes metrics through Azure Monitor, and its Metrics view lets you inspect a chart before using it as the basis for a metric alert.
Read the metric-alert procedure in Microsoft Learn’s Set up alerts in Azure Container Apps:
Set up alerts in Azure Container Apps | Microsoft Learn
Read Microsoft's Container Apps procedure so you can begin with a real metric chart rather than choosing a threshold blindly.
In "Create metric alert rules," begin with the metric procedure. Follow the steps through "Review + create"; the subsequent "Add conditions to an alert rule" subsection explains optional dimensions. For this lab, note where you select the condition, set the threshold, and leave revision or replica splitting off.
Open the backend Container App, then its Metrics view. Look for a request-count metric in the available metric selector and display a recent period in which you can make a few requests. Metric names and available choices are best confirmed in your resource’s selector rather than assumed from an example. If a request-count metric is not available for this app, use another metric whose behavior you can safely observe, such as a displayed replica-count metric, and adapt the threshold to the chart you actually see.
For the request-count option, create New alert rule from the chart. During validation, choose a short aggregation period offered by the portal, a static threshold greater than 0, and no revision or replica split. Confirm the rule’s scope is the backend Container App, not Application Insights. Give it a name such as lab-backend-platform-requests.
This is a pipeline test threshold, not a sensible long-term traffic alert: a healthy backend receiving normal requests would continually satisfy it. After validation, you can replace it with a threshold justified by observed behavior, or delete the lab rule. For a service that may scale to zero, do not treat zero requests as proof of failure; it may simply have no users.
Cost of this practical step: creating an enabled metric alert may add recurring charges. Monitoring multiple dimension series can change the amount charged, so leave splitting off. The handful of requests used below may generate Container Apps usage and Application Insights telemetry; any running database, Container App, or other retained resources continue to incur their normal costs.
Notify someone, then validate the whole path
A fired alert is visible in Azure Monitor even without an action group. For an end-to-end check, attach one email action group to both lab rules. On each rule’s Actions tab, select an existing suitable action group or create one with an email notification under the same lab subscription and resource group. Use an address you can access, but do not put that address in Terraform files or lesson notes. Review each rule to confirm the action group is actually attached.
The notification is evidence that the action path worked; the fired alert in the portal is your primary evidence that the condition worked. If the portal offers Test action group, that can check notification delivery separately, but it does not prove that either alert query or metric threshold fired.
Now validate with minimal traffic:
- While the rules are enabled, send a few ordinary GET requests to a safe backend path. Send one GET request to a nonexistent backend path, such as
/__alert_lab_missing. Do not publish a new route or repeatedly call an endpoint that changes data. - In Application Insights > Logs, rerun the 404 query and inspect the returned request’s time and
resultCode. In the backend Container App’s Metrics view, check whether its request metric reflects the test period. Logs and metrics can appear at different times. - Allow for telemetry ingestion and at least one rule evaluation. Open Azure Monitor > Alerts (or the resource’s Alerts view), select a time range covering the test, and look for each fired lab alert. Check whether the email action group delivered a notification.
If the 404 row exists but its alert does not fire, check that the rule is enabled, scoped to the intended Application Insights resource, and evaluating a time window that still includes the row. If the platform chart shows requests but its alert does not fire, inspect the metric’s selected aggregation and threshold; do not assume that a displayed chart value and an alert evaluation used identical settings. If an alert fired but no email arrived, inspect the attached action group and notification delivery rather than changing the query first.
Cost of validation: a few GET requests should generate little traffic, but their telemetry, Container Apps execution, and alert evaluations can be billable. There is no reliable fixed dollar amount without your region, resources, and pricing. Avoid a load generator; check your budget and resource usage afterward.
Leave useful rules, not lab noise
You have validated an application-telemetry rule and a platform-metric rule, but both thresholds were intentionally easy to trigger. Do not leave them enabled indefinitely as if they were production monitoring.
For an application rule more closely tied to backend failures, you can replace the temporary 404 query with:
requests
| where success == false
| where resultCode startswith "5"
Preview this query in Application Insights Logs before saving the change. It selects failed server-side responses rather than missing paths. Choose its window and threshold from actual traffic: “more than zero in ten minutes” may suit a quiet lab, while a busier service needs a threshold that distinguishes an incident from occasional failures. A zero-row preview only shows that no matching failures were observed in that period; it does not validate a newly changed alert condition by firing it.
Similarly, replace the platform request-count test rule only if you have a platform metric and threshold that answers an operational question. Otherwise, delete both lab rules and the lab-only action group, or disable them until you are ready to configure meaningful conditions. Removing alert rules does not remove the backend, its telemetry destination, or their ongoing costs. If these resources are Terraform-managed, reconcile portal-created lab rules with your infrastructure plan before making a later apply.
The central takeaway is the distinction between observing a signal, testing its condition, and verifying notification delivery. Application Insights request records tell you about backend behavior; Container Apps metrics tell you about the hosting platform. Azure Monitor can alert on each, but a rule is trustworthy only after you have checked its data, scope, evaluation settings, and fired result. This completes the course’s Azure-native observability workflow.