Recommended resources
The freely available resources this lesson will direct you to.
Hello. The previous lesson distinguished the IPCC’s uncertainty language from the statistical estimates that help inform it. We can now put that distinction to work on a concrete claim: recent warming is primarily natural, particularly solar-driven. The question is not whether the Sun affects climate—it does—but whether changes in solar activity can explain most of the warming observed over recent decades.
We will test that claim in three ways: examine the timing of solar and temperature changes, compare the size of their energy effects, and ask what happens when natural drivers are used to explain the historical temperature record. The aim is to evaluate a competing explanation, not merely to find a correlation that favours one.
A plausible cause needs a change of the right size and timing
Nearly all the energy entering Earth’s climate system comes from the Sun. That fact establishes the Sun as an essential energy source, but it does not establish that a change in solar output caused a particular warming trend. To explain recent warming primarily through solar activity, we would need a solar change large enough, at the relevant time, to produce it.
Solar output varies. Its most familiar pattern is the roughly 11-year activity cycle. Sunspots are darker than their surroundings, but bright features associated with solar activity more than compensate for their dimming: measured total solar irradiance is slightly higher near solar maximum. Solar changes may also affect the atmosphere differently at different wavelengths. These are physical reasons to investigate the solar hypothesis rather than dismiss it in advance.
Watch Joanna D. Haigh’s account of what satellite measurements revealed and why a detectable solar influence need not imply that the Sun explains the modern warming trend.
Solar Variability and Climate - Joanna D. Haigh
Watch “Solar Variability and Climate,” presented by Joanna D. Haigh on Serious Science, for the observational basis and physical mechanisms behind solar–climate research.
In satellite observations, focus on the measured solar cycle and the distinction between detecting a solar signal and explaining a long-term trend. Continue with atmospheric effects for why changes at particular wavelengths, especially ultraviolet, remain scientifically interesting even though changes in total solar energy are small.
A useful distinction is solar activity versus total solar irradiance (TSI). Sunspot counts and some longer historical records indicate aspects of the Sun’s magnetic activity; TSI measures the total solar power arriving per unit area at Earth’s distance from the Sun. They are related, but an activity index is not itself an energy budget. Evidence that the Sun was unusually active in an earlier period does not tell us, without further measurement and modelling, that solar forcing was large enough to cause later warming.
Does the solar record track recent warming?
The observational comparison has a particularly informative feature: solar activity increased during part of the early twentieth century, but its longer-term direction since around the middle of that century has not matched the rapid rise in global temperature. An early solar contribution is compatible with the evidence; a solar explanation for most recent warming must also account for the later divergence.
NOAA’s account connects satellite measurements with reconstructions based on earlier sunspot observations. Read it with two different evidential questions in mind: what is measured directly in recent decades, and what must be reconstructed farther back?
Climate Change: Incoming Sunlight | NOAA Climate.gov
Read NOAA Climate.gov’s “Climate Change: Incoming Sunlight” to compare the solar cycle, longer-term solar history, and modern temperature trend.
In the opening discussion, read from the historical comparison; note the time periods attached to its claims. Under “The sunspot cycle,” start at the paragraph beginning “Since the late 1970s, satellites have been documenting the solar cycle directly” and read through the satellite results. Under “Long-term changes in solar activity,” read from the modern comparison. Focus on why activity earlier in the twentieth century does not explain the subsequent sustained warming.
The following graph places yearly values and 11-year averages side by side. The smoother lines help separate a multi-decade direction from oscillations around it.

There are two cautions when reading this figure. First, it uses two vertical axes: the visual distance between the red and yellow lines has no physical meaning, and their slopes cannot be compared as if both used the same units. Compare directions and timing, not their heights on the page. Second, the graph alone does not identify a cause. Temperature responds to multiple influences and need not move in lockstep with any one forcing. The divergence is evidence against a straightforward solar explanation, not a substitute for quantifying the forcings.
Nor does historical overlap settle the matter. A relatively quiet Sun during part of the Little Ice Age, or greater solar activity during the early twentieth century, is worth investigating. But a claim about the cause of late-twentieth- and early-twenty-first-century global warming must pass tests using that period’s measurements and a credible estimate of the resulting climate response. Past correlation cannot, by itself, supply the missing magnitude or timing.
How large is the solar change as a climate forcing?
We can make the scale comparison using the radiative-forcing concepts developed earlier in the course. TSI is measured across a surface facing the Sun. Averaged over Earth’s entire spherical surface, the incoming power per unit area is one-quarter as large; only the fraction not reflected back to space is absorbed. For a small TSI change, the corresponding approximate change in globally averaged absorbed sunlight is
Taking planetary albedo , a TSI difference between parts of a strong solar cycle corresponds to roughly
That is a cycle-related change, not a sustained increase accumulating decade after decade. It is also a simple absorbed-sunlight calculation, not a complete estimate of effective radiative forcing or the temperature response. Ocean heat uptake, the duration of a forcing, and atmospheric responses matter when translating forcing into temperature.
For a comparison over a common historical interval, use the assessed effective radiative forcings below. These figures describe changes from 1750 to 2019, rather than the peak-to-trough movement of one solar cycle.
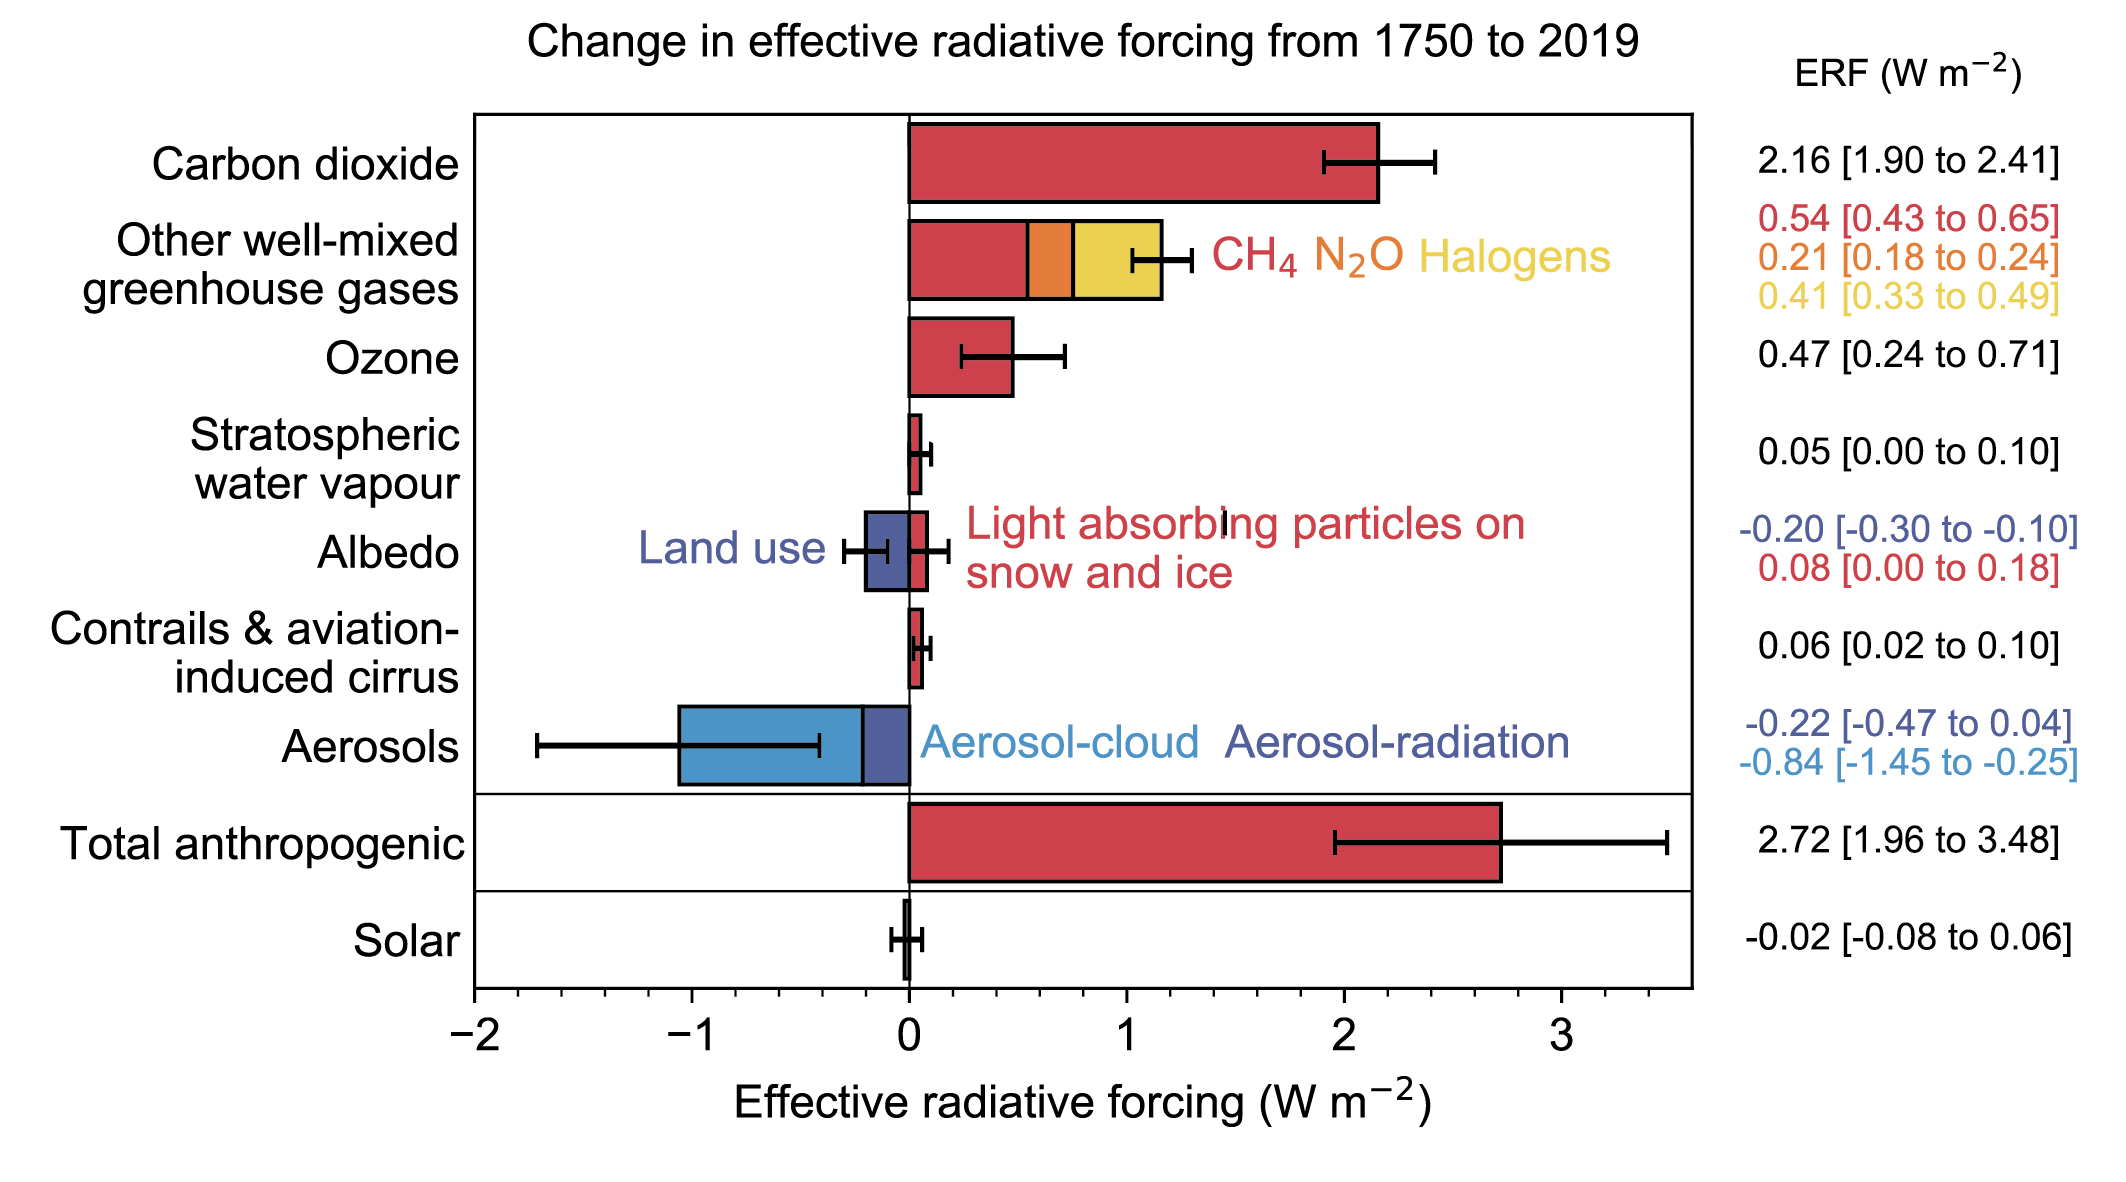
On the chart, carbon dioxide alone is assessed at , while total anthropogenic forcing, after offsets including aerosol cooling, is . The assessed solar change is , with a displayed range of to . The crucial comparison is not that every solar effect is exactly zero; it is that the assessed long-term change in solar forcing is near zero beside a substantial positive human forcing.
You may notice that NOAA gives a small positive solar forcing estimate for a different comparison period. That need not conflict with this figure. A change calculated from 1750 to 2019 is not the same quantity as one calculated from a nineteenth-century baseline to a recent decade; choices of endpoints matter when solar activity oscillates. Also keep TSI changes, measured in irradiance units, distinct from changes in globally averaged forcing. None of these small estimates supports solar activity as the dominant driver of recent warming.
The attribution test: natural drivers together
Solar activity is not the only natural influence. Volcanic eruptions can produce periods of cooling; internal variability, such as exchanges of heat between ocean and atmosphere, can raise or lower surface temperature over shorter intervals. These categories should not be conflated: solar and volcanic changes are external natural drivers, whereas internal variability redistributes energy within the climate system. Both can complicate the surface-temperature record without explaining its long-term warming by themselves.
The IPCC assessment addresses the broader natural-cause claim, not just the solar subset. Read its quantified attribution finding alongside the historical comparison of simulations with and without human influences.
[PDF] Summary for Policymakers - IPCC
Read the IPCC’s Summary for Policymakers for its assessment of natural contributions and the historical natural-only comparison.
On SPM p. 5, find paragraph A.1.3 and read the attribution finding; distinguish the assessed natural-driver contribution from internal variability. On SPM p. 6, locate Figure SPM.1, panel (b). Read its caption from the panel description, then inspect the observed, human-and-natural, and natural-only series in the panel itself. Focus on when the natural-only comparison ceases to account for the observed rise.
For 2010–2019 relative to 1850–1900, the IPCC assesses a likely range of 0.8°C to 1.3°C for total human-caused warming, with a best estimate of 1.07°C. Its assessed contributions are −0.1°C to +0.1°C for natural drivers and −0.2°C to +0.2°C for internal variability. These are assessed ranges, not assertions that natural effects were identically zero in every year. They also describe temperature contributions over a specified period, whereas the preceding forcing chart describes energy-budget changes over a different period.
Figure SPM.1 offers a complementary counterfactual check. Simulations using only natural drivers—solar and volcanic—do not reproduce the large recent rise in observed global surface temperature. Simulations including both human and natural drivers reproduce its broad historical development much better. That comparison is not a claim that models match every year: year-to-year variability and model limitations remain. Its relevance is that adding the proposed natural causes alone does not generate the long-term warming we are trying to explain.
One possible reply is that oceans delay the temperature response to earlier solar increases. Delay is real, so the mismatch between two plotted lines is not, by itself, a proof. But a delayed-solar explanation still has to specify an earlier forcing of sufficient size and produce the observed magnitude and timing. Likewise, proposing an especially powerful response to solar changes requires evidence for why that response would amplify the small assessed solar change sufficiently; it cannot be established simply by pointing to the Sun’s importance as an energy source. The combined forcing estimates and attribution results are the stronger test.
What can—and cannot—be concluded
The defensible conclusion is not “the Sun has no effect on climate.” The solar cycle is measured, solar effects can be detected, and natural influences can enhance or mask warming over particular years or decades. Slower changes in Earth’s orbit also matter greatly to climate on much longer timescales; they are not an explanation for the rapid recent trend.
The stronger claim—that recent global warming was primarily caused by natural forcings, especially solar activity—does not fit the evidence considered together. Solar activity has not shown the sustained rise needed during the main period of recent warming; its assessed long-term forcing change is small compared with human forcing; and natural-only historical simulations do not account for the observed temperature rise. The IPCC’s assessed natural and internal contributions are correspondingly small beside its estimate of human-caused warming.
The next lesson examines how a general circulation model represents the climate system. That will help you assess the simulation comparison more critically: which processes are calculated on the model grid, which are parameterized, and what those choices imply for attribution evidence.