Recommended resources
The freely available resources this lesson will direct you to.
Hello. Last lesson treated attribution as an estimation problem: fit simulated responses to observed temperature changes, then examine the uncertainty in the fitted signals. An IPCC assessment has a further task. It must decide how strongly the available evidence supports a finding and communicate that judgment consistently, whether the finding comes from a fingerprinting study, another method, or several lines of evidence together.
This lesson gives you a way to read that language precisely. In particular, high confidence and very likely answer different questions. We will develop the distinction, then use the IPCC’s assessment of historical warming to see what its uncertainty ranges do—and do not—say.
Two questions hidden inside “How certain are we?”
Consider the finding that human influence caused most recent global warming. You might ask whether a particular fingerprinting estimate is statistically distinguishable from zero. You might also ask whether the broader attribution finding is sound, given the quality of observations, physical understanding, model results, possible biases, and agreement among studies. Those are related questions, but they are not identical.
The IPCC’s uncertainty framework separates two ways of expressing an assessment:
- Confidence concerns the validity of a finding. Assessors judge the evidence—its type, amount, quality, and consistency—and the degree of agreement.
- Likelihood expresses an assessed probability for a specified outcome or result, when the evidence supports a probabilistic statement.
The distinction is especially important if you are accustomed to statistical “confidence.” An IPCC finding with high confidence does not mean a 95% confidence interval, a small -value, or a 95% subjective probability that the finding is true.
Read the IPCC’s guidance at the point where it establishes these two measures and explains how evidence and agreement enter an assessment. The note was written for an earlier assessment cycle; the calibrated framework it describes is also used in the AR6 summary we will read shortly.
Read the IPCC’s Uncertainties Guidance Note for the assessment logic behind its short uncertainty labels.
Begin with the opening description of the two metrics, starting “The AR5 will rely on two metrics.” Then go to numbered paragraphs 8 and 9 (around p. 2). In paragraph 8, read evidence and agreement, paying attention to what makes evidence robust and to cases where a numerical probability is not warranted. In paragraph 9, read from the confidence scale through its key distinction. Focus on why evidence and agreement inform, rather than mechanically determine, the confidence label.
The five confidence qualifiers are very low, low, medium, high, and very high. They summarize an expert assessment, not five numerical probability bins. The guidance allows judgment within the relationship between evidence, agreement, and confidence: a grid showing “robust evidence” and “high agreement” is an aid to assessment, not an equation that automatically returns very high confidence.
That flexibility has a cost as well as a purpose. It lets assessors consider limitations that a simple count of papers would miss—for example, ten studies that share one dataset may provide less independent support than several genuinely different approaches. But a confidence label alone cannot show the reasoning. The framework therefore calls for a traceable account of the evidence and agreement behind a finding.
When does the IPCC put a probability on a claim?
Confidence is useful when assessors can judge the direction or validity of a finding but cannot responsibly specify a probability distribution. When they can quantify uncertainty, they may use calibrated likelihood terms or report a probability range or distribution. The IPCC guidance permits likelihood assessments informed by statistical analyses, model results, and expert judgment; “likelihood” is not shorthand for the output of one particular regression.
Read the guidance on this choice before looking at the vocabulary itself.
Return to the IPCC’s Uncertainties Guidance Note to see when a finding can be reported probabilistically rather than only with a confidence label.
In numbered paragraph 10, read the likelihood explanation. Find Table 1, “Likelihood Scale,” immediately after Figure 1, and read its full set of terms. Then, in paragraph 11’s criteria for reporting a variable, start at criterion B, known sign, and continue through criteria D–F, from ranges and distributions. Notice how the guidance asks assessors to disclose assumptions and structural uncertainty, not merely attach a percentage.
Here are the principal terms you will encounter in AR6:
| IPCC term | Assessed probability of the stated outcome |
|---|---|
| Virtually certain | 99–100% |
| Very likely | 90–100% |
| Likely | 66–100% |
| About as likely as not | 33–66% |
| Unlikely | 0–33% |
| Very unlikely | 0–10% |
| Exceptionally unlikely | 0–1% |
When appropriate, AR6 also uses extremely likely (95–100%), more likely than not (greater than 50–100%), and extremely unlikely (0–5%). The boundaries are treated as somewhat “fuzzy,” and the categories overlap. Very likely, for example, is a stronger lower-bound assessment than likely; it is not a mutually exclusive bucket alongside it.
Always identify the outcome to which a likelihood attaches. “It is likely that human-caused warming lies between two values” assesses a range. “Human influence very likely contributed to a change” assesses a causal claim. Neither phrase, on its own, gives you a complete probability distribution. Equally, about as likely as not describes an outcome assessed near an even chance; it is not the IPCC’s code for “we have too little evidence to tell.”
There is a subtle statistical distinction here. A conventional frequentist confidence interval has a coverage property under a specified sampling procedure. An IPCC likely range is an assessed probability range for the stated outcome, potentially integrating several methods and expert judgments. You should not silently replace one interpretation with the other, even if a statistical interval helped inform the assessment.
Reading an attribution statement rather than just its adjective
Now turn to the AR6 Working Group I Summary for Policymakers. Its introduction and footnote 4 specify the report’s calibrated language. Section A.1.3 then supplies a compact attribution assessment, while Figure SPM.2 shows how several of its quantities are communicated visually.
IPCC AR6 Working Group 1: Summary for Policymakers | Climate Change 2021: The Physical Science Basis
Read the IPCC’s AR6 Summary for Policymakers to apply the uncertainty framework to its assessment of historical warming.
In Introduction, read the paragraph beginning key findings. Follow its footnote 4, located among the notes at the bottom of the page, from the definitions. Then go to A. The Current State of the Climate, subsection A.1.3. Read the finding from human-caused warming through its statements about individual contributors. Finally, find Figure SPM.2, “Assessed contributions to observed warming in 2010–2019 relative to 1850–1900.” Read its caption from panels a–c, including the different likelihood levels assigned to their whiskers.
Section A.1.3 assesses the likely range of total human-caused global surface warming from 1850–1900 to 2010–2019 as 0.8°C to 1.3°C, with a best estimate of 1.07°C. It separately assesses likely greenhouse-gas warming of 1.0°C to 2.0°C and likely cooling from other human drivers, principally aerosols, of 0.0°C to 0.8°C. The assessed natural-driver contribution is −0.1°C to +0.1°C, and the internal-variability contribution is −0.2°C to +0.2°C.
Every range has a defined variable, baseline, and period. The greenhouse-gas range is not a range for net human warming: cooling from other human influences offsets some of it. Nor can you add the lower endpoints of separately reported ranges to obtain the lower endpoint of the total. The components’ uncertainties can be related, and their marginal ranges need not attain their extremes together.
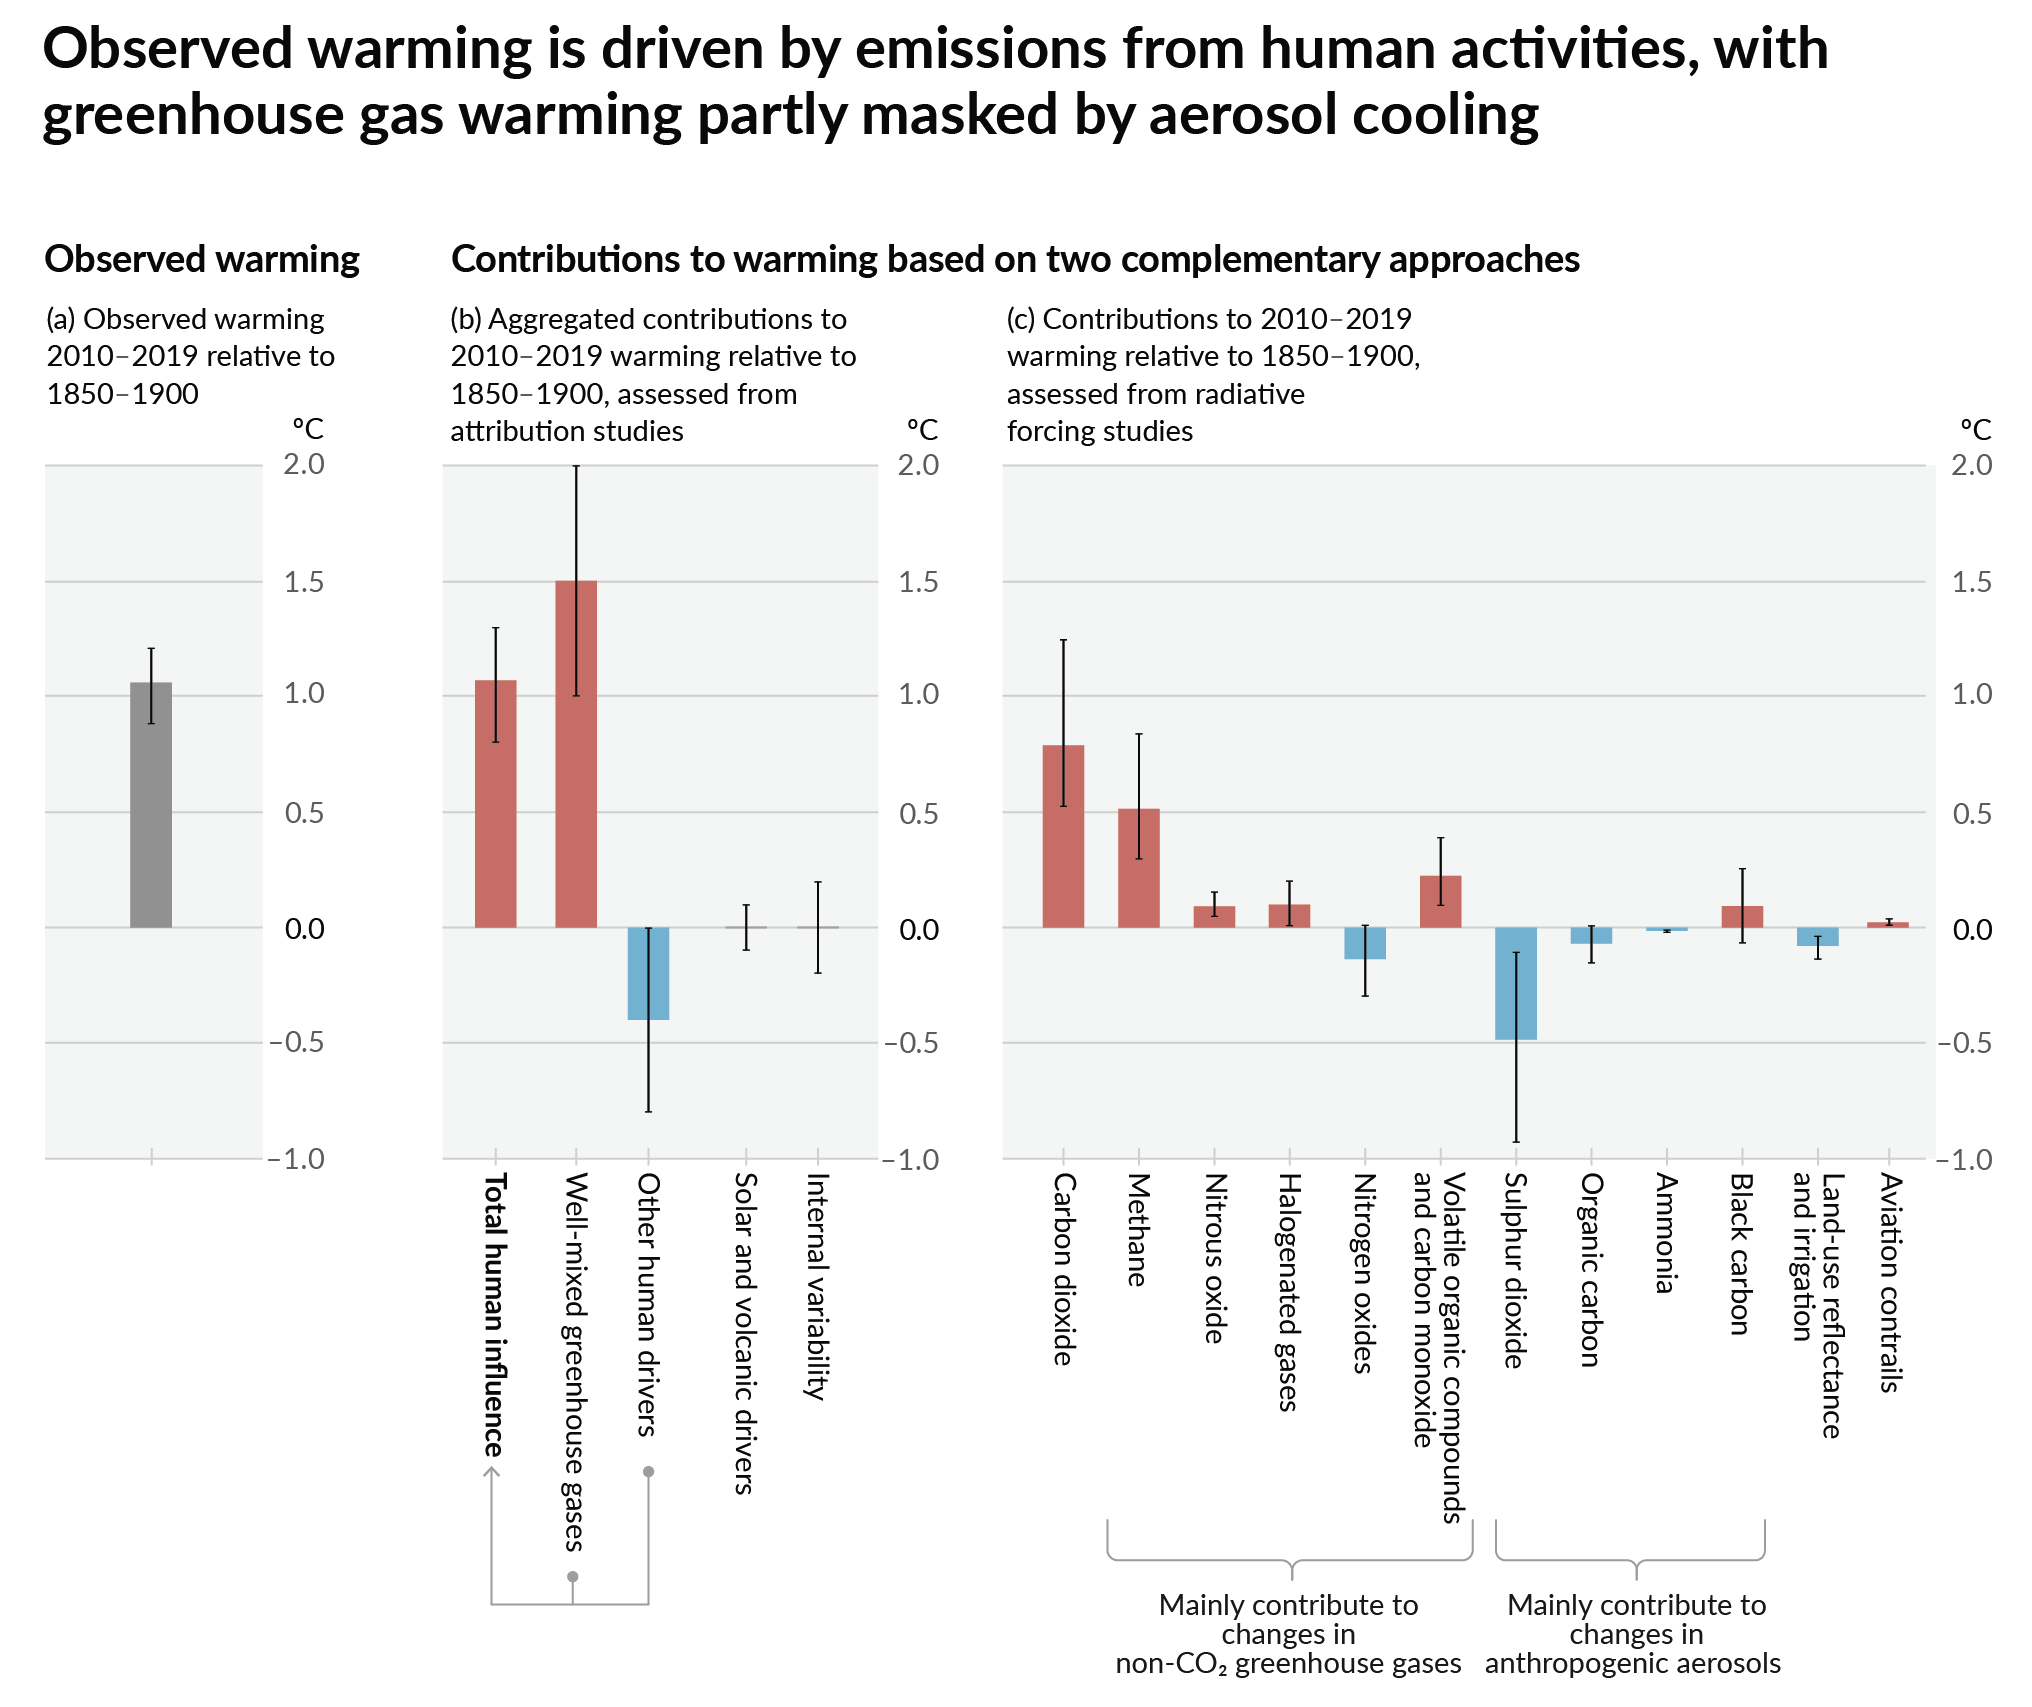
The figure makes an easy reading error visible. Panel (b)’s whiskers are likely ranges; panel (c)’s are very likely ranges. You cannot compare their lengths as though both depict the same probability coverage or arise from the same estimation method. Panel (b) synthesizes attribution studies of observed warming. Panel (c) assesses individual human drivers through radiative forcing and climate sensitivity. These are complementary approaches, not two versions of the fingerprinting regression from last lesson.
There is also a difference between saying how much warming is attributable to a driver and saying whether it contributed. A range for a driver’s magnitude can be broad even when its contribution has a well-supported sign. Conversely, a small estimated natural contribution does not mean that solar activity or internal variability had exactly zero effect. Read the claim at the precision at which it is stated.
What the labels protect against—and what they cannot do
The AR6 summary opens its historical assessment with: “It is unequivocal that human influence has warmed the atmosphere, ocean and land.” Its introduction permits key findings to be stated as facts as well as with calibrated uncertainty labels. “Unequivocal” is not an extra row in the likelihood table; assigning it an invented percentage would make the statement seem more formally quantified than the report makes it.
Attribution claims elsewhere in the summary are more qualified. For example, section A.1.7 says human influence was very likely the main driver of global mean sea-level increases since at least 1971. Section A.1.5 describes only limited evidence, with medium agreement, of human influence on Antarctic Ice Sheet mass loss. The labels differ because the claims and their evidential bases differ. Strong global temperature attribution does not automatically transfer its certainty to every region, variable, or process.
The framework is disciplined, but it is not a machine that converts a literature review into an objective percentage. Three checks are useful when evaluating an attribution statement:
- Specify the proposition. Is it about detecting a change, assigning a cause, estimating the cause’s magnitude, or identifying the main driver? A single sentence can contain more than one of these.
- Inspect the basis for its uncertainty language. Is the report expressing confidence grounded in evidence and agreement, an assessed probability, a range, or some combination? Could shared datasets or model limitations make apparently separate lines of evidence less independent?
- Respect the scope and qualifications. Time period, geography, measured variable, and alternative causes all matter. A likely range leaves possibilities outside it; it does not assert that those possibilities are impossible.
These checks connect back to optimal fingerprinting. A fitted scaling factor and its uncertainty can contribute to the evidence for attribution. The IPCC’s final statement may additionally weigh physical mechanisms, other observational evidence, and methodological limitations. The final likelihood term is therefore not simply a regression -value translated into words. Neither is qualitative confidence a license to overlook statistical results: both belong in the traceable account.
Key takeaways
The IPCC communicates uncertainty through qualitative confidence, grounded in evidence and agreement, and probabilistic likelihood, used for specified outcomes when quantification is justified. Confidence has five labels but no fixed numerical conversion; likelihood terms have calibrated probability ranges. In an attribution statement, first identify the exact claim and its scope, then interpret the label or interval attached to it.
Figure SPM.2 shows why this care matters: different panels assess contributions using different approaches and display different probability ranges. The next lesson will examine a competing causal account of recent warming—natural forcing, particularly solar activity—and assess it against the attribution evidence rather than against a temperature trend alone.