Recommended resources
The freely available resources this lesson will direct you to.
- Mastering LLM Inference Optimization From Theory to Cost Effective Deployment: Mark Moyouwww.youtube.com
- How to pick a GPU and Inference Engine?www.youtube.com
- TCO Calculator LLM H100 GPT-OSS | Cost Analysis 2025www.byteplus.com
- Local LLMs vs Cloud APIs: 2026 Total Cost of Ownership Analysiswww.sitepoint.com
Welcome to the final lesson in our module on advanced routing and cost modeling. In our last session, you mastered the process of technical capacity planning: translating a target throughput requirement into a specific number of GPU instances needed to meet your performance SLOs. We concluded that to meet our goal, we might need, for example, 20 GPUs plus an additional buffer for redundancy and headroom.
Today, we will take that technical plan and translate it into a full financial projection. Your extensive background in SRE and infrastructure automation has undoubtedly involved creating Total Cost of Ownership (TCO) models for various systems. We'll now apply that same rigor to the unique cost drivers of LLM infrastructure. This lesson bridges the gap from "how many GPUs?" to "how much will this cost?" and "is it worth it?".
By the end of this 60-minute lesson, you will be able to construct a comprehensive cost projection for a planned GPU deployment and validate that projection against a budget and alternative deployment models, such as using cloud APIs.
1. From Capacity Planning to FinOps: The TCO Framework
Before we start calculating, let's visualize where cost projection fits within the broader AI/ML platform architecture. As you know from your SRE work, managing infrastructure isn't just about keeping it running; it's about doing so efficiently and cost-effectively.
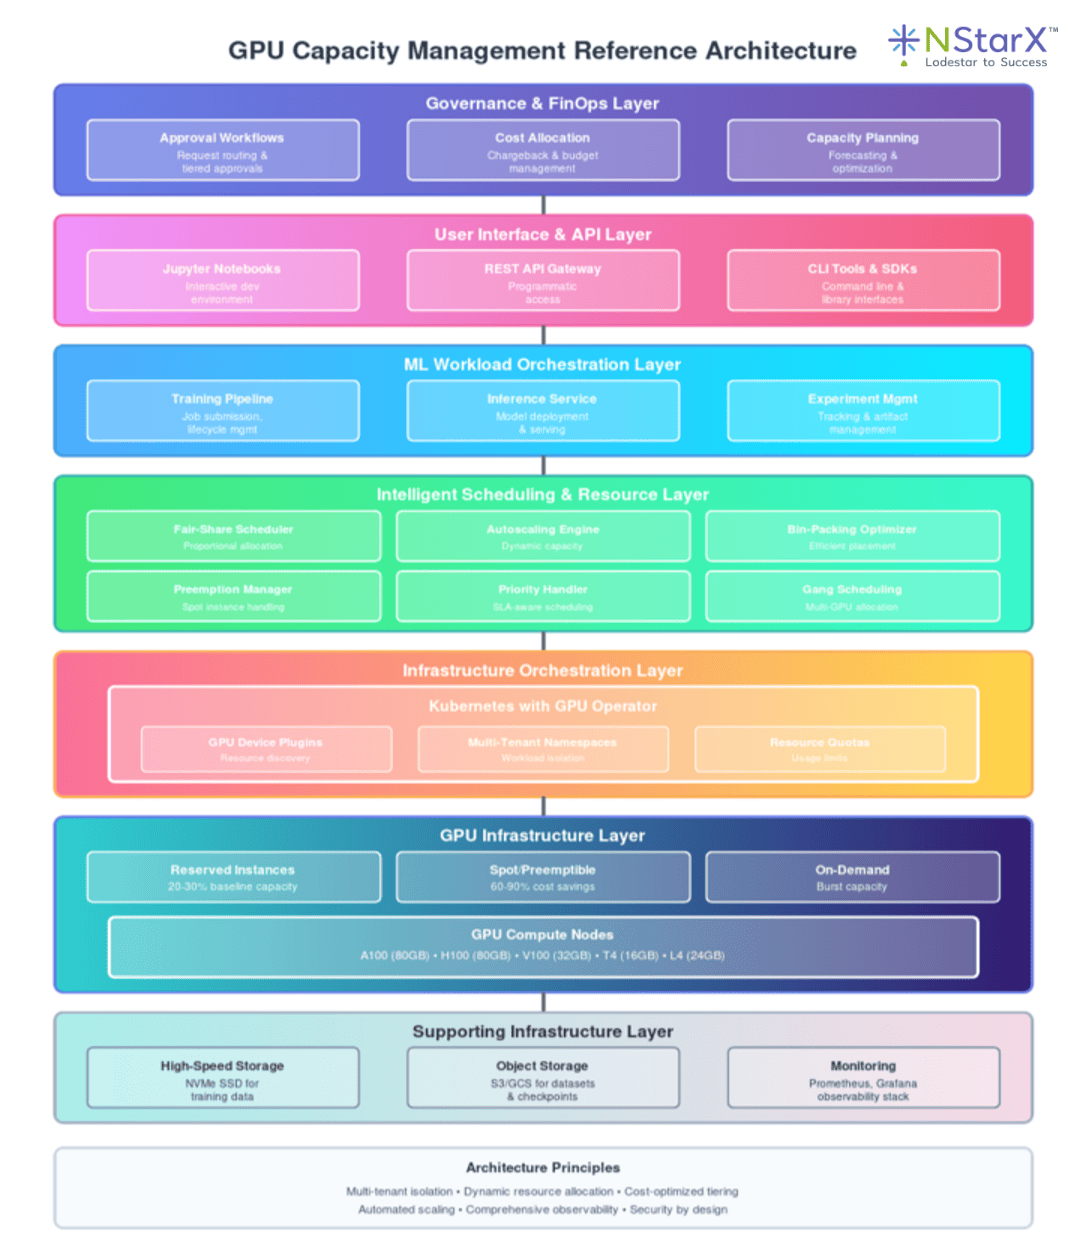
The primary tool for this is the Total Cost of Ownership (TCO) analysis. TCO provides a holistic view of all direct and indirect costs over the lifecycle of an asset, which is essential for making a sound business case.
TCO Calculator LLM H100 GPT-OSS | Cost Analysis 2025
This article from BytePlus provides an excellent introduction to TCO for LLMs and breaks down the core cost components.
Please read the first two sections, "Introduction to TCO for large language models" and "Components of TCO in GPT-OSS LLM deployment". As you read, focus on how the cost categories map to your experience with traditional cloud infrastructure, and note the elements unique to LLM systems.
As the article outlines, a TCO model for a self-hosted LLM deployment consists of two main parts:
- Capital Expenditures (CapEx): The one-time, upfront costs.
- GPU & Server Hardware: The price of the physical servers, including GPUs (e.g., NVIDIA H100s), CPUs, RAM, and storage. An 8-GPU server can cost upwards of $400,000.
- Networking Infrastructure: High-speed interconnects like InfiniBand, which are crucial for multi-node training or inference.
- Operational Expenditures (OpEx): The recurring costs to run and maintain the system.
- Personnel: The salaries for the specialized MLOps and AI engineers needed to manage the system. This is often the largest single cost component.
- Power & Cooling: High-end GPUs are power-hungry. An 8-GPU server can draw over 10 kilowatts, leading to significant annual electricity bills.
- Software & Maintenance: Costs for enterprise software licenses, support contracts for open-source tools (like vLLM or TGI), and hardware maintenance agreements.
- Data Center Costs: Fees for rack space, physical security, and bandwidth if using a colocation facility.
Understanding these components is the first step toward building a realistic financial model.
2. Building a Cost Projection: A Step-by-Step Example
Let's make this concrete by building a sample TCO projection. We will follow the case study provided in the BytePlus article, which assumes a scenario that requires an 8x NVIDIA H100 server. This aligns with a "Heavy Tier" workload we might have dimensioned in our previous lesson.
TCO Calculator LLM H100 GPT-OSS | Cost Analysis 2025
This section provides a complete, worked-out example of a 3-year TCO calculation.
Please read the "Case study" section. Pay close attention to the assumptions made and how each cost component we just discussed is quantified.
Let's summarize the calculation from the article:
Assumptions:
- Hardware: 1 x 8-GPU NVIDIA HGX H100 Server
- Personnel: 2 MLOps Engineers, 1 AI Engineer
- Location: US data center ($0.12/kWh)
- Analysis Period: 3 years
TCO Breakdown:
-
Total CapEx (Upfront Cost):
- Server Hardware: $400,000
- Networking & Racking: $30,000
- Total: $430,000
-
Total Annual OpEx (Recurring Cost):
- Personnel: $535,000
- Power & Cooling: $18,220
- Software & Maintenance: $76,600
- Total: $629,820 per year
-
3-Year TCO Calculation:
The most striking insight here is that personnel costs over three years ($1.6M) are nearly 4x the initial hardware cost. This is a critical point that is often missed when focusing only on the high sticker price of GPUs. Your role as an LLM Ops engineer includes making this reality clear during budget discussions.
3. Validating the Projection: Build vs. Buy
Having a TCO figure of $2.32M is only useful when compared to an alternative. The primary alternative to self-hosting is using a commercial API service like OpenAI, Anthropic, or Google. This is the classic "build vs. buy" decision.
To make this comparison, we need a common unit of cost. The industry standard is dollars per million tokens ($/M tokens).
The Trelis Research video provides a masterclass in calculating this metric for self-hosted models by combining hardware rental costs with benchmarked performance.
How to pick a GPU and Inference Engine?
This video, "How to pick a GPU and Inference Engine?", demonstrates a practical approach to calculating the cost-effectiveness of different GPU setups.
Please watch the final major section of the video, from Comparing Costs. The presenter builds a spreadsheet that calculates the cost per million output tokens for various Llama models on different GPUs (A40, A100, H100) and with different quantization levels. This is the exact process you would follow to compare the cost-effectiveness of different hardware options for your own deployment.
The video's methodology reveals several key insights:
- Cheapest GPU ≠ Cheapest Cost/Token: The A40 GPU has the lowest hourly rental cost, but for larger models, the more powerful H100 can be more cost-effective on a per-token basis due to its much higher throughput.
- Performance vs. Cost Trade-off: While cheaper GPUs might offer a lower cost per token, they also result in much higher latency (lower tokens/second), which could violate your user experience SLOs.
- Quantization Impacts Cost: Using INT4 or FP8 quantization reduces memory requirements and can increase speed, directly lowering the cost per token, but it comes with a potential trade-off in output quality.
The Break-Even Analysis
Now, let's compare our self-hosted TCO to API costs. The SitePoint article provides detailed comparison tables.
Local LLMs vs Cloud APIs: 2026 Total Cost of Ownership Analysis
This article offers a head-to-head TCO comparison between local deployments and cloud APIs across different usage tiers.
Review the sections "Head-to-Head TCO Comparison Tables" and "Break-Even Analysis". Compare the "Heavy Tier" local deployment costs with the API costs.
According to the SitePoint analysis, for a heavy tier (50M tokens/day):
- 12-Month Local TCO: $308,347
- 12-Month OpenAI API Cost: $126,000
- 12-Month Open-Weight Hosted API Cost: $36,000
At first glance, the APIs seem dramatically cheaper. However, look at the 36-month analysis. The local TCO becomes $391,707, while the OpenAI API cost triples to $378,000. The local option becomes cost-competitive with premium APIs over a longer timeframe.
A Critical Note on Assumptions: You may have noticed the TCO from BytePlus ($2.3M) is much higher than SitePoint's ($391k). Why? The primary difference is the personnel cost assumption. BytePlus assumes a fully dedicated team of three, while SitePoint's "ops labor" is a much smaller number, likely assuming an existing team takes on the work. This highlights the most important aspect of any TCO model: your assumptions drive the outcome. As the lead engineer, you must clearly define and defend these assumptions.
4. The Role of Observability in Cost Management
Finally, remember that a cost projection is a forecast. Once deployed, you must track actual usage and costs. This is where your observability skills and tools like Grafana become essential for FinOps.

By analyzing request patterns, you can make data-driven decisions. For example, you might observe that 80% of your requests are short input/short output, which could be served by a smaller, cheaper model, allowing you to route traffic more intelligently and reduce costs.
Mastering LLM Inference Optimization From Theory to Cost Effective Deployment: Mark Moyou
Mark Moyou's talk on inference optimization provides expert commentary on how understanding usage patterns is key to managing cost.
Watch the segment on querying patterns, which explains how different types of requests (long input/short output, etc.) have different cost and performance profiles. Then, watch the next clip on using a 2D histogram to statistically analyze your production traffic. This analysis is fundamental to both capacity planning and ongoing cost optimization.
Conclusion
You have now completed the journey from technical capacity planning to financial cost projection. This process is central to the role of an LLM Ops Engineer, requiring a blend of deep technical knowledge and sound business acumen.
Key Takeaways:
- TCO is Comprehensive: A credible cost projection must use a TCO model that includes CapEx (hardware) and OpEx (power, cooling, software, and especially personnel).
- Personnel is the Dominant Cost: For self-hosted solutions, the cost of the specialized engineering team often exceeds the hardware investment over the system's lifecycle.
- Validate Against Alternatives: The primary purpose of a TCO projection is to enable a "build vs. buy" decision by comparing the self-hosted cost against third-party API pricing on a per-million-token basis.
- Assumptions are Everything: The validity of your cost model depends entirely on the realism of your assumptions regarding hardware costs, personnel needs, electricity rates, and usage patterns.
- Observability Closes the Loop: Continuous monitoring of actual cost and usage is critical for validating projections and identifying optimization opportunities.
This lesson concludes our module on Advanced Routing and Cost Modeling. You are now equipped with a powerful framework for planning, provisioning, and budgeting for large-scale LLM services.
In our next and final module, we will begin the Capstone Project. You will design a complete, end-to-end LLM deployment pipeline, applying all the skills you've acquired throughout this course. Your first task will be to design the CI/CD pipeline that automates the deployment of a new model version.