Recommended resources
The freely available resources this lesson will direct you to.
Hello! In our last lesson, we broke down the fundamental cost drivers of an LLM serving endpoint, formulating how to calculate the effective cost per token from raw infrastructure expenses like GPU-hours and data egress.
Today, we'll take the next crucial step: using that knowledge and combining it with observability data to build a complete cost model. We're moving from low-level infrastructure metrics to high-impact business metrics: dollars-per-request and, more importantly, dollars-per-successful-task. Your extensive experience with observability platforms like ELK and New Relic provides a perfect foundation for instrumenting and capturing the data we'll need for this model.
By the end of this lesson, you will be able to build a model that calculates these two key financial metrics, enabling you to connect technical operations directly to business value.
1. The Foundation: Observability for Cost Management
You can't manage what you don't measure. Calculating granular costs is impossible without a robust observability pipeline that treats every LLM call as a traceable transaction. In LLM Ops, this often means creating a standardized "usage event" for every interaction.
This is a familiar concept from your SRE work, but with a specific schema tailored to LLMs. The goal is to avoid "cost fog," where spending increases but you can't attribute it to a specific feature, user, or workflow.
AI Observability for SaaS Leaders: LLM Quality, Latency, Cost ...
The article from Apptension frames the problem perfectly. It discusses common failure modes in AI observability, including "Cost fog," and lays out the minimum data needed to avoid it.
Please read the sections "Why AI observability breaks in SaaS (and where it hurts first)" and "Instrument every LLM run." Focus on the concept of cost fog and the recommended minimum event schema.
As the article highlights, a comprehensive usage event is the cornerstone of any cost model. Let's look at a practical, code-based definition of such an event.
How to Build Cost Management for LLM Operations
The article "How to Build Cost Management for LLM Operations" from OneUptime provides a fantastic, practical guide with code. We will be using this resource extensively in today's lesson.
Start by reviewing the Usage Event Schema section. Examine the LLMUsageEvent dataclass. Note the key fields that enable cost analysis: model, provider input_tokens, output_tokens cost_usd success and error_code Attribution fields like project_id, team_id, and user_id
This LLMUsageEvent is the structured log that our cost model will consume. Your entire system—from API gateways to application code—must be instrumented to produce these events for every LLM interaction.
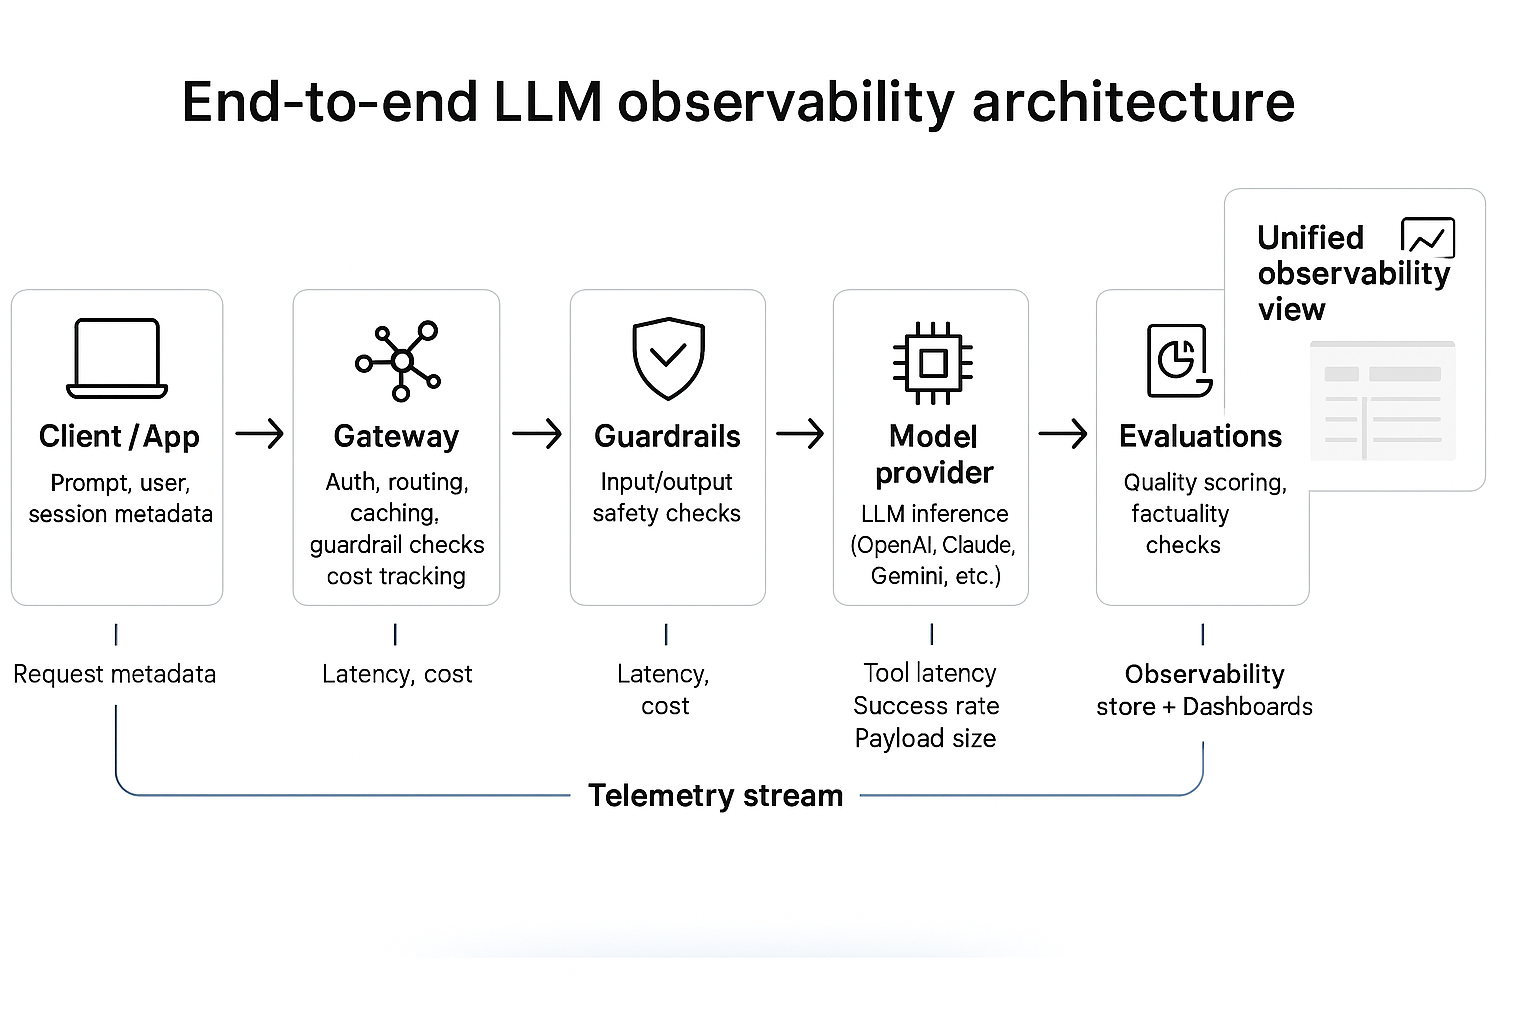
This diagram shows a typical architecture where a gateway and telemetry stream work together to collect metrics like cost, token counts, and success rates at each stage of a request. This is the infrastructure that produces the LLMUsageEvent data.
2. Calculating Dollars-per-Request
With the right data structure in place, calculating the cost of a single, successful API request is the first step. This metric answers the question: "What is the marginal cost of one more call to this endpoint?"
The calculation relies on two components:
- The token counts (
input_tokens,output_tokens) from the LLM API response. - A pricing service that knows the cost-per-token for each model.
The formula is one we've touched on before:
Let's see how this is implemented in a real system.
How to Build Cost Management for LLM Operations
Returning to the OneUptime article, we'll now look at the implementation details.
Please read the following sections: "Token-Based Pricing": Briefly review the calculate_cost function to see the core formula in action. "Cost Calculator Service": Study the LLMPricingService class. This component acts as a centralized source of truth for model pricing. "Usage Collector with OpenTelemetry Integration": Focus on the track_usage method within the LLMCostCollector class. This is where everything comes together: it takes token counts as input, calls the pricing_service to calculate cost_usd, and then records the final LLMUsageEvent.
This LLMCostCollector is a perfect example of the kind of component you would build as an LLM Ops engineer. It encapsulates the logic for capturing and enriching observability data for cost analysis.
Many off-the-shelf observability tools, like LangSmith, provide this functionality out of the box.
The REAL cost of LLM (And How to reduce 78%+ of Cost)
The video "The REAL cost of LLM" by AI Jason provides a practical demonstration of using LangSmith for cost analysis.
Watch the segment from the LangSmith demo. The presenter runs a research agent, inspects the trace in LangSmith, and shows exactly how the platform breaks down token consumption and calculates the total cost for the agent's run (around 60 cents in his example).
3. Calculating Dollars-per-Successful-Task
While dollars-per-request is useful, it's often misleading. A user's "task" might involve multiple LLM requests (e.g., a chain of API calls or retries after a failure). If some of those requests fail or the final output is useless, the true cost of achieving a successful outcome is higher than the cost of a single request.
This brings us to the more powerful metric: dollars-per-successful-task. This metric aligns cost directly with the value delivered to the user.

This diagram provides a concise formula for "Cost per successful task," defining it as the sum of token, tool, and retry costs, divided by the number of correct tasks. This captures the total effort required to achieve a valuable outcome.
To calculate this, you need to expand your definition of cost and success:
- Total Task Cost: The sum of costs from all LLM requests, tool calls, and retries involved in completing one logical task.
- Successful Task: A task whose final outcome is deemed valuable. This is a business logic definition, not a technical one. A task can be unsuccessful even if all its API calls returned a
200 OK.
The articles from Apptension and OneUptime both emphasize this crucial distinction.
AI Observability for SaaS Leaders: LLM Quality, Latency, Cost ...
Let's revisit the Apptension article, which champions this concept.
Read the sections "The three metrics that actually map to user pain" and "Cost signals: cost per outcome, not cost per request." Note the emphasis on tracking cost per successful outcome and how a drop in quality can cause this metric to spike even if token spend is flat.
How to Define "Success"
The success boolean in your LLMUsageEvent becomes critical here. However, its value must be determined by your application based on a clear definition of a successful outcome. Examples include:
- Implicit Signals: The user copied the generated text, or did not immediately re-run the query.
- Explicit Signals: The user gave a "thumbs up" rating.
- Automated Evals: The output passed a set of predefined quality checks (e.g., it produced valid JSON, or it didn't contain a hallucination).
- Human-in-the-loop: A human reviewer approved the generated content.
4. Building the Aggregated Cost Model
Now, let's combine these concepts into an analytical model. This isn't a machine learning model, but a financial one built on top of your observability data store (e.g., Elasticsearch, Prometheus, or a data warehouse).
The process looks like this:
- Instrument: Your application generates a detailed
LLMUsageEventfor every request and stores it. Each event contains token counts, a success flag, and attribution IDs (likeuser_id,project_id, ortrace_id). - Calculate per-request cost: A process (like the
LLMCostCollector) enriches each event by calculatingcost_usdbased on token counts and a pricing table. - Aggregate for Dashboards: A dashboarding service queries this data to compute the final metrics.
The following resource shows exactly how to implement the final aggregation step.
How to Build Cost Management for LLM Operations
The OneUptime article provides a CostDashboardService class that performs these aggregations.
Read the section "Implementing Real-Time Cost Dashboards." Pay close attention to the get_organization_dashboard method. See how it calculates current_spend and total_requests over a time period. The logic for avg_cost_per_request is simply:
This service is the final piece of the puzzle, turning a stream of raw event data into actionable financial insights for your dashboards. Tools like LiteLLM's dashboard provide a UI for this kind of analysis.
LiteLLM: Free Open Source Gateway to Manage All Your LLM Providers
The video "LiteLLM: Free Open Source Gateway to Manage All Your LLM Providers" shows a simple dashboard for this purpose.
Watch the brief segment from the usage section. This demonstrates how an observability tool can surface the total number of successful requests and the associated costs, allowing you to compare providers and manage spending.
Conclusion
In this lesson, you've learned how to construct a comprehensive cost model by leveraging detailed observability data. This moves you beyond simple infrastructure cost analysis and into the realm of business-focused financial modeling, a key responsibility for a senior LLM Ops Engineer.
Key Takeaways:
- Observability is paramount: Accurate cost modeling is impossible without instrumenting every LLM call to generate a detailed usage event containing token counts, success flags, and attribution data.
- Dollars-per-Request: This is a foundational metric calculated for each API call using token counts and a pricing service.
- Dollars-per-Successful-Task: This is a more meaningful business metric that accounts for the total cost (including retries and multi-step chains) required to deliver a valuable outcome. Its calculation depends on a clear, application-specific definition of "success."
- The Model is an Aggregation: The cost model is built by aggregating the enriched usage events from your observability store to produce dashboard-ready metrics like
avg_cost_per_requestandavg_cost_per_successful_task.
In our next lesson, we'll shift from retrospective analysis to forward-looking planning. You'll learn how to use user traffic projections and SLOs to estimate the required inference throughput for your service, a critical skill for capacity planning and budget forecasting.