Recommended resources
The freely available resources this lesson will direct you to.
- Mastering LLM Inference Optimization From Theory to Cost Effective Deployment: Mark Moyouwww.youtube.com
- LLM Pricing Explained (OpenAI API Pricing)www.youtube.com
- Compare GPU Cloud Pricing for LLM Inference Workloadswww.gmicloud.ai
- GPU Cloud Pricing 2026: Real AI Inference Cost Analysis | byteiotabyteiota.com
Hello! In our last session, we built an intelligent router that uses policies to direct requests to the most appropriate model, balancing cost, latency, and quality. That was a crucial step in managing the operational efficiency of an LLM system.
Today, we'll dive deeper into the "cost" part of that equation. To make effective routing decisions and manage budgets, you need to understand precisely what drives the expense of an LLM serving endpoint. We will dissect the total cost of ownership (TCO) and formulate the key financial drivers. This lesson will directly leverage your extensive experience with cloud infrastructure costs, applying those principles to the unique characteristics of LLM workloads.
By the end of this lesson, you will be able to identify and formulate the primary cost drivers for an LLM endpoint, including GPU-hour costs, the derived per-token cost, and data egress fees.
1. Two Models of Cost: Metered APIs vs. Self-Hosted Infrastructure
When deploying an LLM, your first major decision determines the entire cost structure: will you use a third-party API or host the model yourself?
- API-based Service (e.g., OpenAI, Anthropic): You pay a metered rate based on usage, typically priced per token. This is an Operational Expense (OpEx) model that abstracts away all infrastructure management.
- Self-Hosted Service (e.g., on AWS, Azure, CoreWeave): You rent GPU infrastructure and pay for it by the hour, along with associated costs for data, storage, and networking. This is also an OpEx model but gives you direct control over the infrastructure.
Let's first understand the simpler API model.
The Metered API Model: Paying Per Token
Providers like OpenAI and Anthropic have popularized a straightforward pricing model based on the number of tokens you process. A key detail is that they almost always charge different rates for input (prompt) tokens and output (generated) tokens.
This video provides an excellent explanation of this model.
LLM Pricing Explained (OpenAI API Pricing)
The video "LLM Pricing Explained" by Tommy Eberle clearly breaks down the per-token API pricing model.
Please watch the following sections: Subscription vs. API Billing: Understand the difference between a flat-rate consumer subscription and pay-as-you-go API billing. Input vs. Output Tokens: This is the most critical part. Note how providers price the tokens you send (input) differently from the tokens the model generates (output). Calculating Interaction Cost: See the practical example of using a tokenizer to count tokens and applying the pricing formula to find the total cost of a single API call.
As the video shows, the formula is simple:
API Request Cost = (Input Tokens × Cost per Input Token) + (Output Tokens × Cost per Output Token)
This model is predictable on a per-request basis but can be expensive at scale, which is why many teams opt to self-host.
2. Deconstructing Self-Hosting Costs: The Total Cost of Ownership
For an LLM Ops engineer, understanding self-hosting costs is paramount. Here, the simple per-token price disappears, and you must calculate it yourself from the underlying infrastructure costs. Your background in managing cloud environments on AWS and Azure will be invaluable here.
The key cost drivers for a self-hosted LLM endpoint are:
- GPU Compute Cost (GPU-hour)
- Data Egress Fees
- "Hidden" Infrastructure Taxes (Virtualization, Storage, etc.)
Let's break these down.
Driver 1: GPU-Hour Cost
The most significant and obvious cost is the hourly rate for the GPU instance. However, not all GPU-hours are equal. The market is segmented, and prices vary dramatically.
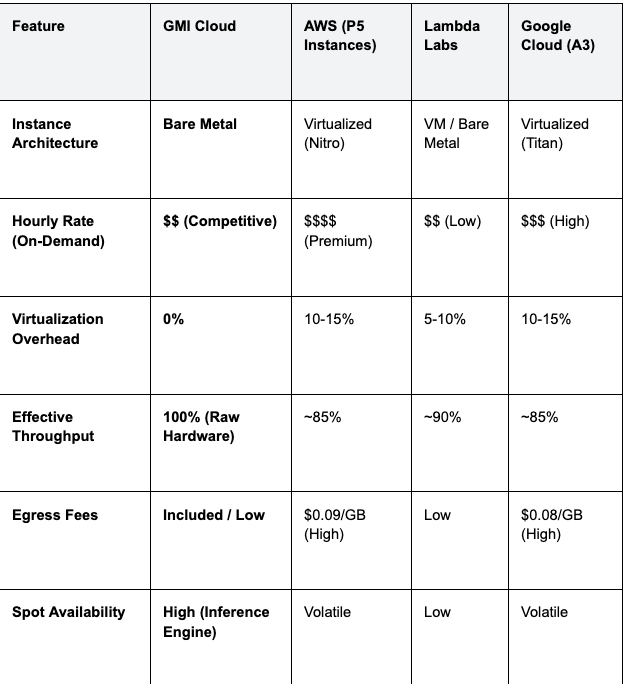
As seen in the table and the article below, there are three main tiers of providers:
- Hyperscalers (AWS, Google Cloud, Azure): Offer the highest prices but come with a broad ecosystem, enterprise support, and compliance certifications.
- Specialized AI Clouds (CoreWeave, Lambda, GMI Cloud): Offer much lower hourly rates, often on bare-metal hardware, striking a balance between cost and reliability.
- Peer-to-Peer Marketplaces (Vast.ai): Offer the lowest prices but with variable reliability, making them suitable for experiments but risky for production.
GPU Cloud Pricing 2026: Real AI Inference Cost Analysis | byteiota
This article, "GPU Cloud Pricing 2026," provides a concise breakdown of the GPU cloud market.
Please read the section titled "Choosing the Right Tier: Hyperscalers vs Specialized AI Clouds vs Peer-to-Peer." This will give you a clear mental model of the provider landscape and their corresponding price points for raw GPU-hour cost.
From GPU-Hour to Effective Per-Token Cost
A cheap hourly rate is meaningless if the GPU is slow. The metric that truly matters is the effective cost per token, which connects the hourly rate to the system's performance (throughput).
The fundamental formula is:
This formula reveals that a more expensive GPU can be cheaper overall if its throughput is sufficiently high. The resources below provide a detailed analysis of this principle.
Compare GPU Cloud Pricing for LLM Inference Workloads
This guide from GMI Cloud introduces the mathematical model for inference unit economics.
Read the first two sections, "The Unit Economics of Inference: A Mathematical Model" and "The H200 vs. H100 Pricing Paradox." Focus on how memory bandwidth and batch size contribute to Total_System_Throughput_TPS and how this can make a GPU with a higher hourly rate more cost-effective.
The system's throughput isn't a fixed number; it's highly dependent on the workload. In our previous module, we discussed the prefill and decode phases. The characteristics of your user traffic—the mix of input and output lengths—directly impact throughput and, therefore, cost.
This next video explains how different query patterns stress the system in different ways, ultimately affecting performance and cost.
Mastering LLM Inference Optimization From Theory to Cost Effective Deployment: Mark Moyou
Mark Moyou's presentation, "Mastering LLM Inference Optimization," offers deep insights into the LLM workload.
Watch the segment from the most important slide. The speaker breaks down four common query patterns (long input/short output, long/long, short/long, short/short) and explains how each one impacts GPU memory and processing time.
Understanding your application's typical query patterns is essential for accurately benchmarking throughput and calculating your true cost per token.
Driver 2: Data Egress Fees
Data egress—the cost of data leaving a cloud provider's network—is a familiar concept in cloud finance. For LLM applications, it becomes a major cost driver because every generated token is data egress. A high-traffic chatbot or summarization service can generate terabytes of text per month.
GPU Cloud Pricing 2026: Real AI Inference Cost Analysis | byteiota
Let's revisit the "GPU Cloud Pricing 2026" article.
Read the section "Hidden GPU Cloud Costs: Egress Fees and Virtualization Tax." Pay close attention to the example figures. AWS might charge $0.09 per gigabyte, which can add 20-40% to your total bill. Specialized providers often bundle generous egress allowances, making their effective TCO much lower.
The formula for this component is:
Egress Cost = Total Gigabytes Generated × Cost per Gigabyte
This cost is often overlooked in initial estimates but can be a major factor in your monthly bill.
Driver 3: The "Hypervisor Tax" and Other Hidden Costs
When you rent a VM from a hyperscaler, you don't get 100% of the hardware's power. The hypervisor that manages the VM consumes resources, creating a "virtualization tax" that reduces performance.
Compare GPU Cloud Pricing for LLM Inference Workloads
This article from GMI Cloud quantifies these additional costs.
Read the sections "Hidden Costs of Virtualization," "Inter-Node Networking Costs," and "Model Storage Costs." Note how the "Hypervisor Tax" can reduce performance by 10-15%, effectively increasing your hourly rate. Also, be aware of secondary costs like cross-AZ networking for multi-GPU models and storage IOPS charges.
This "tax" directly impacts our core formula. If you're losing 15% of performance to virtualization, your effective hourly rate for the performance you get is actually higher:
For a $4.00/hour instance with 15% overhead, the effective rate is $4.00 / (1 - 0.15) = $4.70/\text{hour}$.
3. Your Turn: Formulate and Compare Costs
Let's apply these concepts to a practical scenario. Imagine you need to deploy a Llama 3 70B model and are evaluating two options.
Scenario Data:
- Option A: Hyperscaler (e.g., AWS)
- GPU: NVIDIA H100
- Nominal Hourly Rate: $4.00/hr
- Virtualization Overhead: 15%
- Benchmark Throughput (on bare metal): 4,000 tokens/sec
- Data Egress Fee: $0.09/GB
- Option B: Specialized AI Cloud
- GPU: NVIDIA H200
- Nominal Hourly Rate: $2.50/hr
- Virtualization Overhead: 0% (Bare Metal)
- Benchmark Throughput: 5,000 tokens/sec
- Data Egress Fee: $0/GB (within a large allowance)
Assume 1 million tokens is approximately 750 KB or 0.00075 GB.
Your Task (10-15 minutes):
- Calculate the Effective Cost per Million Tokens for both options.
- First, find the effective hourly rate for Option A.
- Second, find the actual throughput for Option A after accounting for virtualization.
- Then, use the
Effective Cost Per Tokenformula and multiply by 1,000,000.
- Calculate the Egress Cost for Option A if the service generates 50 billion tokens in a month.
- Based on your calculations, which option offers a lower Total Cost of Ownership for this workload?
Solution
Here is the step-by-step calculation:
1. Effective Cost per Million Tokens
-
Option A: Hyperscaler (H100)
- Effective Hourly Rate = $4.00 / (1 - 0.15) = $4.706/hr
- Actual Throughput = 4,000 tokens/sec * (1 - 0.15) = 3,400 tokens/sec
- Cost per Second = $4.706 / 3600 = $0.001307/sec
- Cost per Token = $0.001307 / 3,400 = $0.000000384
- Cost per Million Tokens = $0.384
-
Option B: Specialized AI Cloud (H200)
- Effective Hourly Rate = $2.50/hr (no overhead)
- Actual Throughput = 5,000 tokens/sec
- Cost per Second = $2.50 / 3600 = $0.000694/sec
- Cost per Token = $0.000694 / 5,000 = $0.000000139
- Cost per Million Tokens = $0.139
2. Egress Cost for Option A
- Total Tokens: 50,000 million
- Data Generated (GB) = 50,000 * 0.00075 GB = 37,500 GB
- Total Egress Cost = 37,500 GB * $0.09/GB = $3,375 per month
3. Conclusion
- Option B is significantly more cost-effective.
- The cost per million tokens for compute is nearly 3 times lower ($0.139 vs $0.384).
- Option A also incurs an additional $3,375 per month in data egress fees, which Option B does not. This highlights how critical it is to look beyond the sticker price and account for all cost drivers.
Conclusion
In this lesson, you learned to deconstruct the costs of running an LLM serving endpoint, moving from high-level concepts to concrete formulas. This analytical approach is fundamental to your role as an LLM Ops Engineer.
Key Takeaways:
- API vs. Self-Hosted: The cost model is fundamentally different. APIs offer a simple pay-per-token model, while self-hosting requires a full TCO analysis.
- Key Cost Drivers: For self-hosting, the primary drivers are the GPU-hour cost, the resulting effective cost per token (which depends on throughput), and data egress fees.
- Look Beyond Sticker Price: The cheapest hourly rate is not always the most economical. Higher throughput, bare-metal performance (no hypervisor tax), and inclusive egress policies often result in a lower TCO.
- Formulation is Key: By using formulas to calculate effective rates and unit costs, you can make objective, data-driven decisions about infrastructure and provider selection.
In our next lesson, we will build on this foundation. Now that you can identify and calculate the core cost drivers, we will develop a complete model to calculate dollars-per-request and dollars-per-successful-task, translating infrastructure metrics into business-critical financial insights.