Recommended resources
The freely available resources this lesson will direct you to.
- Comparing Perfect Competition & Monopolistic Competitionwww.youtube.com
- 4 Industry Types: Monopoly, Oligopoly, Monopolistic competition and perfect competitionwww.youtube.com
- Price Determination in Different Market Structures - maseconomicsmaseconomics.com
- [PDF] Efficiency - Market Structureswearequrious.com
Introduction
Welcome to the final lesson in our module on imperfect competition. Over the past several lessons, we have explored each of the four main market structures in detail: perfect competition, monopoly, monopolistic competition, and most recently, the strategic world of oligopoly. We've seen how firms decide on output and pricing, from the price-taking behavior in perfect competition to the interdependent strategies of oligopolists.
Today, we will synthesize all of this knowledge. Our goal is to step back and compare these four structures side-by-side. We will focus on three critical dimensions: the resulting price, the level of output, and, most importantly, the economic efficiency of the market outcome. This comparative analysis will provide you with a powerful framework for evaluating how market structure impacts consumers, firms, and society as a whole.
Comparing the Four Market Structures: A High-Level Overview
Let's begin by framing our comparison. The four market structures exist on a spectrum, from the most competitive (perfect competition) to the least competitive (monopoly). The key distinguishing features are the number of firms, the type of product, and the barriers to entry. These features fundamentally determine a firm's ability to influence price, also known as its market power.
To get a quick overview of the key differences, please watch the following video.
4 Industry Types: Monopoly, Oligopoly, Monopolistic competition and perfect competition
This video from Ashley Hodgson provides a concise introduction to the main points of comparison we'll be discussing today, including strategic behavior, elasticity of demand, and long-run profitability.
Please watch the entire video (up to 07:30). Pay attention to how the number of competitors influences strategic behavior, the shape of the demand curve, and the potential for long-run profits.
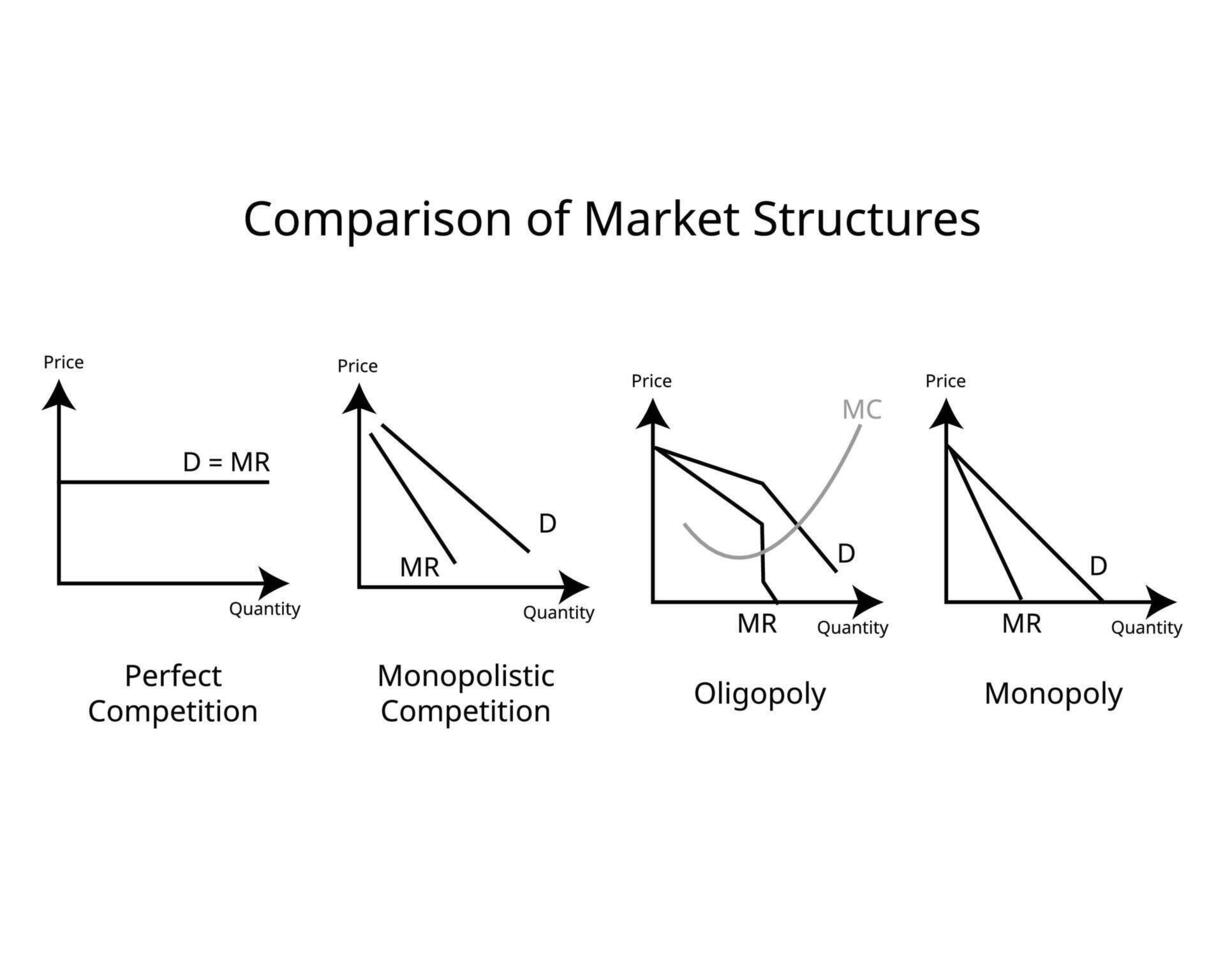
As the video highlights, a firm's market power is directly reflected in the demand curve it faces. A firm in perfect competition faces a perfectly horizontal (perfectly elastic) demand curve, meaning it has no power to set prices. In contrast, a monopolist faces the entire downward-sloping market demand curve, giving it significant pricing power.
Price, Output, and Long-Run Profitability
Let's formalize the comparison of price, output, and profit. The fundamental rule for profit maximization, MR = MC, applies across all market structures. However, the relationship between price and marginal cost is what truly differentiates them.
Price Determination in Different Market Structures - maseconomics
The article 'Price Determination in Different Market Structures' provides an excellent text-based summary of how price and output are determined in each market. We will focus on the summary table which pulls all the key information together.
Please read the section titled 'Summary of Price Determination Across Market Structures' and carefully study the comparison table. Focus on the 'Price Determination' and 'Outcome' columns for each structure.
From your reading, we can establish a clear hierarchy:
- Perfect Competition: Firms are price takers, so they produce where
P = MC. Free entry and exit ensure that in the long run, economic profits are driven to zero. This structure results in the lowest price and the highest output. - Monopoly: The firm is a price maker and maximizes profit where
P > MR = MC. High barriers to entry allow the monopolist to sustain positive economic profits in the long run. This structure leads to the highest price and the lowest output. - Monopolistic Competition: Firms have some market power due to product differentiation, so they set price where
P > MC. However, like perfect competition, free entry drives long-run economic profits to zero. Price and output fall between perfect competition and monopoly. - Oligopoly: Price and output are outcomes of strategic interaction. If firms collude, they can act like a monopolist (high price, low output). If they compete aggressively, they may approach a more competitive outcome. Generally, the result is between monopolistic competition and monopoly.
Comparing Economic Efficiency
The most important comparison we can make is on the grounds of efficiency. In economics, we primarily consider two types of efficiency:
- Productive Efficiency: This is achieved when goods are produced at the lowest possible cost per unit. Graphically, this occurs when a firm produces at the minimum point of its Average Total Cost (ATC) curve.
- Allocative Efficiency: This is achieved when a society's resources are allocated to produce the mix of goods and services that consumers most value. This occurs when the price consumers are willing to pay for a good (
P) equals the marginal cost of producing it (MC). WhenP = MC, it signals that the value to society of the last unit produced is exactly equal to the cost of the resources used to produce it.
Let's see how the market structures stack up on these criteria.
[PDF] Efficiency - Market Structures
This PDF document, 'Efficiency - Market Structures', offers a clear, graphical explanation of productive and allocative efficiency and then applies these concepts to each market structure.
First, read the sections defining 'Productive Efficiency' and 'Allocative Efficiency' to solidify your understanding of these two concepts. Then, jump to the 'Summary' section and study the table that compares the efficiency of each market structure. This table is a crucial takeaway.
As the resource shows, perfect competition is the only market structure that achieves both productive and allocative efficiency in the long run. It serves as the theoretical benchmark for an efficient market. All other structures are inefficient.
-
Monopoly is allocatively inefficient because
P > MC. This means consumers value the last unit produced more than it cost to make, so society would benefit from more output. This inefficiency results in a deadweight loss. It is also productively inefficient as it doesn't produce at the minimum of its ATC curve. -
Monopolistic Competition is also inefficient on both counts. This is a subtle but important point, especially in the long run. To explore this further, watch the following video comparing it directly with perfect competition.
Comparing Perfect Competition & Monopolistic Competition
This video provides an excellent graphical comparison of the efficiency of monopolistic competition and perfect competition.
Please watch the full video. Pay close attention to why a monopolistically competitive firm is neither productively nor allocatively efficient, even when it is making zero economic profit in the long run.
The video makes two key points about monopolistic competition's inefficiency:
- Productive Inefficiency: Even with zero long-run profit, the firm produces on the downward-sloping portion of its ATC curve, not at the minimum. This is sometimes called having "excess capacity."
- Allocative Inefficiency: The firm still sets
P > MC, creating a deadweight loss just like a monopolist, albeit a smaller one.
However, the video ends on an important note: this inefficiency may be the price we pay for product variety. While a perfectly competitive market for restaurants would mean every restaurant is identical and sells food at the lowest possible cost, most consumers prefer the variety and choice offered in a monopolistically competitive market.
Summary: A Complete Comparison
We have now compared the four market structures across all our key dimensions. The table below brings all these points together for a final summary.

Here is a simplified ranking from most competitive and efficient to least competitive and efficient:
| Rank | Market Structure | Price | Output | Profit (Long-Run) | Allocative Efficiency (P=MC?) | Productive Efficiency (P=min ATC?) |
|---|---|---|---|---|---|---|
| 1 | Perfect Competition | Lowest | Highest | Zero | Yes | Yes |
| 2 | Monopolistic Comp. | Low | High | Zero | No | No |
| 3 | Oligopoly | High | Low | Positive | No | No |
| 4 | Monopoly | Highest | Lowest | Positive | No | No |
This framework demonstrates a core trade-off in microeconomics: as firms gain more market power, prices tend to rise, output falls, and markets become less efficient, transferring welfare from consumers to producers.
Conclusion
In this lesson, we synthesized our knowledge of the four main market structures. We've established a clear hierarchy based on competitiveness and efficiency, moving from the perfectly efficient benchmark of perfect competition to the highly inefficient outcome of monopoly.
Key Takeaways:
- Market structures can be ranked on a spectrum from perfect competition (most competitive) to monopoly (least competitive).
- Perfect competition is the only structure that is both productively efficient (producing at minimum average cost) and allocatively efficient (
P = MC) in the long run. - Monopoly, oligopoly, and monopolistic competition are all inefficient. They produce less and charge a higher price than is socially optimal because they set
P > MC. - In monopolistic competition, the inefficiency can be seen as the trade-off for consumer benefits like product variety and choice.
- The more market power a firm has, the higher the price, the lower the output, and the greater the deadweight loss to society.
This lesson concludes our deep dive into how firms behave in different competitive environments. In the next module, we will broaden our scope to look at other reasons why markets might fail to produce efficient outcomes, a topic known as market failures. We will begin by exploring the concept of externalities, where the actions of a producer or consumer have spillover effects on third parties.