Recommended resources
The freely available resources this lesson will direct you to.
Introduction
Welcome to the first lesson of our eighth module, "Measuring the Macroeconomy." In the first seven modules, we focused on microeconomics—the study of how individual households and firms make decisions and interact in specific markets. We concluded by looking at how governments intervene when markets fail.
Now, we shift our perspective from the individual trees to the entire forest. We begin our study of macroeconomics, which examines the economy as a whole. Our goal is to understand economy-wide phenomena like economic growth, inflation, and unemployment.
To start, we need a map of the economy. The circular flow model is a simple but powerful diagram that illustrates how money, goods, and resources move between the major economic players. It provides the conceptual framework for understanding the national economic data we'll explore in upcoming lessons.
In line with your goal of building a rigorous foundation, this model is the starting point for all macroeconomic analysis. It connects the spending of one group to the income of another, revealing a fundamental identity that underpins everything that follows.
Our learning outcome for today is to interpret the circular flow model showing interactions between households, firms, and the government.
1. The Core of the Economy: The Two-Sector Model
At its most basic level, the economy consists of two main groups: households and firms.
- Households are individuals like you and me. We own the factors of production (labor, land, capital) and we consume goods and services.
- Firms are the organizations that produce goods and services.
These two groups interact in two distinct markets:
- The Product Market: Where firms sell goods and services (e.g., laptops, coffee, consulting services) to households.
- The Resource (or Factor) Market: Where households sell the factors of production (e.g., their labor, land for a factory) to firms.
This interaction creates two flows: a flow of physical things (goods and labor) and a corresponding flow of money.
To see how this works, let's watch a short, engaging video that illustrates this fundamental relationship.
Circular Flow Matrix- How the economy works
The following video from Jacob Clifford provides a clear and energetic introduction to the basic circular flow model, showing the interactions between households and businesses in both the product and resource markets.
Please watch from the beginning until 02:10. As you watch, focus on distinguishing between the 'product market' and the 'resource market', and notice how the flow of money moves in the opposite direction to the flow of goods and resources.
As the video explained, there are two parallel loops:
- Real Flow: Households provide factors of production to firms, who in turn provide goods and services to households. This is the flow of actual things.
- Money Flow: Firms pay households income (wages, rent, profit) for their resources. Households then use this income to spend on goods and services, which becomes revenue for the firms. This is the flow of money.
A critical insight from this simple model is that, in this economy, total spending must equal total income. This is because every dollar a household spends is a dollar of revenue for a firm, which then becomes income for a household. This fundamental equivalence—Production = Spending = Income—is the basis for how we measure the entire economy.
To reinforce this concept, please read a brief excerpt that explains this key insight.
This text from Saylor Academy's 'Macroeconomics: Theory through Applications' reinforces the logic of the simple two-sector model and explicitly states the equivalence between production, spending, and income.
Read the sections titled 'The Simplest Version of the Circular Flow' and the 'Key Takeaway' that follows it. Pay attention to how the text uses Figure 3.11 and Figure 3.12 to distinguish between the money flow and the real flow, and how it concludes that GDP, production, income, and spending are interchangeable terms.
2. Adding Government: The Three-Sector Model
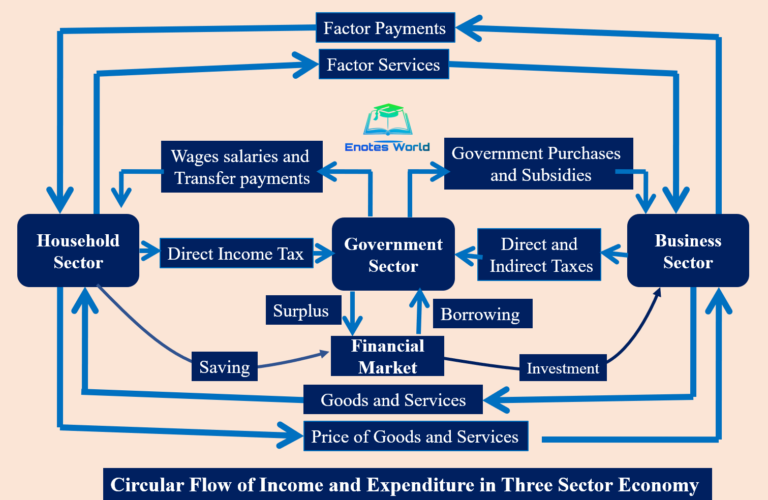
Our simple model is useful, but it's missing a major player in any modern economy: the government. The government interacts with both households and firms, adding new flows to our model.
The government's main economic activities are:
- Taxation: It collects taxes from both households (e.g., income tax) and firms (e.g., corporate profits tax).
- Government Spending: It purchases goods and services from firms (e.g., defense equipment, office supplies) and buys factors of production from the resource market (e.g., hiring public employees like teachers and police officers).
- Transfer Payments: It gives money to households without receiving a good or service in return (e.g., social security, unemployment benefits). These are different from government purchases.
Let's see how the government fits into our diagram.
Circular Flow Matrix- How the economy works
We'll return to the Jacob Clifford video to see how the government is integrated into the circular flow.
Watch the segment from 02:54 to 04:02. Notice how the government collects taxes from both households and firms and injects spending back into both the product and resource markets.
The introduction of the government complicates our simple flow. Money is now being withdrawn from the private economy via taxes, but also added back in through government spending and transfers.
The image below provides a detailed, static map of this three-sector economy, including the financial market, which channels savings from households to be used for investment by firms or borrowing by the government.
3. Leakages and Injections
The addition of the government and financial markets allows us to introduce two important macroeconomic concepts: leakages and injections.
-
Leakages (or Withdrawals) are flows of money that are withdrawn from the primary circular flow of income and spending. In a three-sector model (also including savings), the main leakages are:
- Savings (S): Income that households do not spend, but instead place in the financial system.
- Taxes (T): Income paid to the government.
-
Injections are flows of money that are added into the circular flow. The main injections are:
- Investment (I): Spending by firms on capital goods (e.g., machinery, new factories), often financed by borrowing from the financial system.
- Government Spending (G): Spending by the government on goods and services.
(Note: If we were to include the rest of the world—the fourth sector—imports would be a leakage and exports would be an injection.)
The health of the macroeconomy depends on the balance between these leakages and injections.
- If Injections > Leakages, more money is entering the flow than leaving it. The economy tends to grow.
- If Leakages > Injections, more money is leaving the flow than entering it. The economy tends to contract.
- If Injections = Leakages, the economy is in a state of macroeconomic equilibrium.
The following video and reading provide a more formal explanation of these crucial concepts.
Y1 2) Circular Flow of Income & Measures of GDP
This video from EconplusDal clearly defines leakages and injections and explains how their relationship determines the direction of economic activity.
Please watch from 01:33 to 05:23. Focus on the definitions of the three leakages (Savings, Taxes, Imports) and the three injections (Investment, Government Spending, Exports) and the condition for macroeconomic equilibrium.
To solidify your understanding and see the formulas used, please refer to the following text. Since you've expressed an interest in textbook resources, this PDF guide provides a concise yet thorough summary.
[PDF] Economics Second Chance Self Study Guide Circular Flow
This study guide provides clear, formal definitions of injections and leakages, complete with the equations used to calculate their total values.
Read the section titled 'Injections and leakages' (pages 11-13). Pay attention to the definitions of each component (I, G, X, S, T, M) and the equations for total injections (J = G + X + I) and total leakages (L = T + M + S). Note the clear explanation of economic equilibrium (J=L).
Conclusion
In this lesson, we have constructed a foundational map of the macroeconomy. We started with the basic interactions between households and firms and then incorporated the government to create a more realistic three-sector model.
Key Takeaways:
- The circular flow model illustrates the flow of money, goods, services, and factors of production among the key economic sectors.
- The economy can be viewed through two corresponding flows: the real flow of tangible items and the money flow of payments.
- In its simplest form, the model shows that production generates income, and this income is used for spending, creating a circular flow where Income = Spending = Production.
- The government influences the flow by collecting taxes (a leakage) and adding government spending (an injection).
- The balance between total injections (I + G) and total leakages (S + T) determines whether the overall level of economic activity is expanding, contracting, or in equilibrium.
This model is more than just a diagram; it's the conceptual underpinning for how we measure national economic output. The components of spending in the circular flow—by households, firms, and the government—are precisely what we will use to define and calculate the most important measure of economic health.
Preview of the Next Lesson:
In our next lesson, we will use the framework of the circular flow to formally define and calculate Gross Domestic Product (GDP). We will focus on the expenditure approach, which measures GDP by summing up the spending from all the sectors we've identified today: Consumption (C), Investment (I), Government Spending (G), and Net Exports (NX).