Recommended resources
The freely available resources this lesson will direct you to.
- Equilibrium price and quantity from changes in both supply and demandwww.youtube.com
- Demand, Supply, and Equilibriumsaylordotorg.github.io
- Effects of shifts in supply and demand on equilibriumwww.sparkl.me
- Double Shifts- Supply and Demandwww.youtube.com
- When Demand and Supply Shift at the same timewww.youtube.com
- The Interaction of Supply and Demand - Pearsonwww.pearsoncanada.ca
Hello! In our last lesson, we brought supply and demand together to find the market's stable equilibrium point. You learned how to determine the equilibrium price and quantity both on a graph and by solving the supply and demand equations—a process that likely felt familiar given your analytical background.
So far, our model has been static. But real-world markets are constantly in motion, influenced by countless events. Today, we'll analyze what happens when a market is hit by two separate events at the same time. Our goal is to predict how simultaneous shifts in supply and demand affect equilibrium outcomes. This is a crucial skill for understanding complex market dynamics, as it's rare for only one factor to change at a time.
1. The Challenge of "Double Shifts"
Imagine the market for smartphones. What happens if a new, popular feature increases consumer desire for the latest models (a demand shift) at the same time that a shortage of microchips makes them more expensive to produce (a supply shift)? Both price and quantity will be affected, but how?
When both the supply and demand curves shift simultaneously, we have a "double shift." The result can be tricky because the two shifts might push the price or quantity in opposite directions. As we'll see, this leads to a situation where the final change in one variable is certain, but the change in the other is indeterminate, meaning it could go up, down, or stay the same.
To start, let's watch a quick video that introduces this core concept and a powerful trick for solving these problems.
Double Shifts- Supply and Demand
This video from Jacob Clifford provides a high-energy introduction to double shifts and presents the key takeaway for this lesson: one variable (price or quantity) will always be indeterminate.
Watch the first 1 minute and 49 seconds of the video. Focus on the main rule of double shifts and the method he proposes for figuring out which variable is indeterminate.
2. A Systematic Approach to Analyzing Simultaneous Shifts
As the video explained, the most reliable way to analyze a double shift is to break it down. Instead of trying to visualize both shifts at once, we can use a systematic process:
- Analyze the first shift: Determine how the first event affects either supply or demand. Note its impact on equilibrium price () and quantity ().
- Analyze the second shift: Do the same for the second event. Note its independent impact on and .
- Combine the results: Compare the effects from both shifts.
- If both shifts push a variable in the same direction (e.g., both cause to increase), the final effect on that variable is certain.
- If the shifts push a variable in opposite directions (e.g., one causes to increase and the other causes to decrease), the final effect is indeterminate. The result depends on which shift is larger.
Let's walk through this method with a detailed example.
Changes in equilibrium price and quantity: the four-step process
This article from Khan Academy details a four-step process for analyzing market changes. We will focus on the final section, which applies this process to a scenario with two simultaneous shifts.
Please read the section titled 'A combined example: the US Postal Service.' Observe how the author first analyzes the effect of higher worker compensation (a supply shift) and then analyzes the effect of a change in tastes (a demand shift) before combining them to find the final outcome.
The US Postal Service example perfectly illustrates our systematic approach:
- Shift 1 (Higher wages for postal workers): This increases the cost of production, shifting the supply curve to the left. The result is a higher price () and a lower quantity ().
- Shift 2 (People switch to email): This reflects a change in tastes, shifting the demand curve to the left. The result is a lower price () and a lower quantity ().
Now, let's combine them:
- Effect on Quantity: Both shifts cause the quantity to decrease. Therefore, we can say with certainty that the equilibrium quantity of postal services will decrease.
- Effect on Price: The supply shift pushes the price up, while the demand shift pushes the price down. The net effect is indeterminate. Without knowing the magnitude of each shift, we can't know if the final price will be higher, lower, or the same.
3. Visualizing Why Indeterminacy Happens
The reason one variable becomes indeterminate is that the final equilibrium depends on the relative size of the shifts. A graph makes this clear.
The following video provides an excellent visual walkthrough of this concept. It shows how, by drawing a small shift versus a large shift, you can get different results for the indeterminate variable.
When Demand and Supply Shift at the same time
This video from econhelp methodically demonstrates why indeterminacy occurs. It uses graphs to show how the final equilibrium changes based on the magnitude of the supply and demand shifts.
Watch from timestamp 1:37 to the end. Pay close attention to how the presenter combines the separate analyses and then draws three different graphs to show the three possible outcomes for the indeterminate variable (quantity in this case).
To reinforce this key idea, look at the image below. It shows a market where both demand and supply increase.

As you can see, when demand and supply both increase:
- Quantity () definitely increases.
- Price () is indeterminate. It rises if the demand shift is bigger (Graph A) and falls if the supply shift is bigger (Graph B).
4. A Summary of All Possible Scenarios
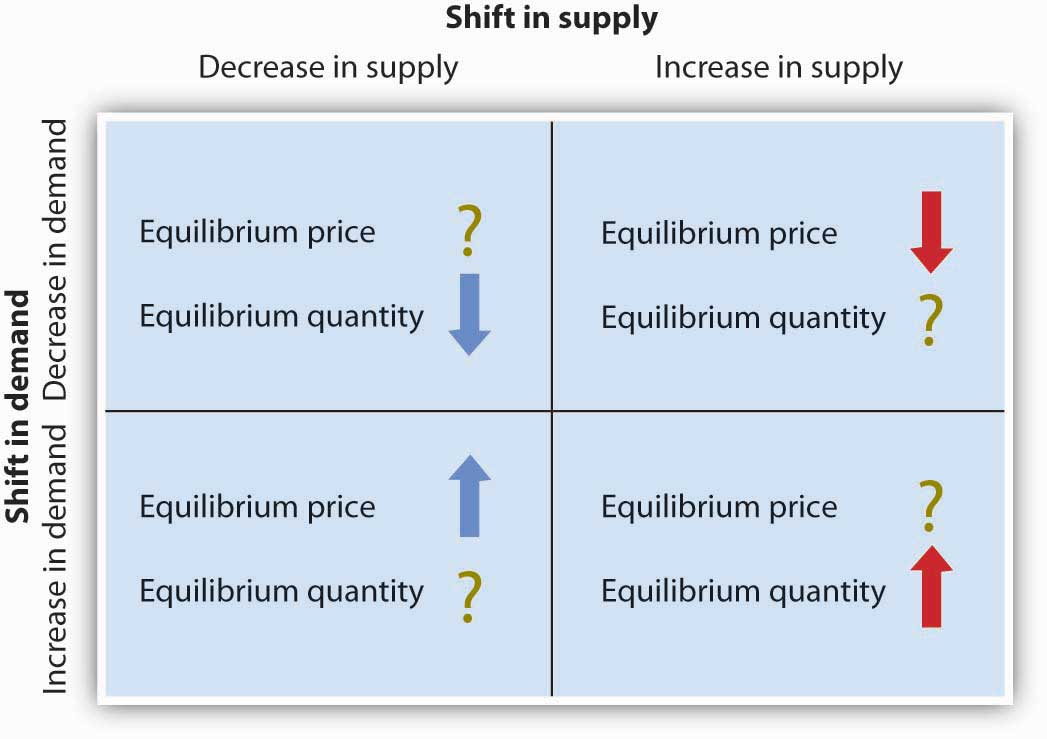
We have now established a reliable method for analyzing any combination of simultaneous shifts. There are four main possibilities:
- Demand increases & Supply increases
- Demand decreases & Supply decreases
- Demand increases & Supply decreases
- Demand decreases & Supply increases
The table below from a Pearson textbook provides a complete summary of the outcomes for all possible combinations.
[PDF] Where Prices Come From: The Interaction of Supply and Demand
This PDF excerpt from a textbook contains a very useful summary table that catalogs all possible double-shift scenarios.
Find and study 'Table 3.3: How Shifts in Demand and Supply Affect Equilibrium Price (P) and Quantity (Q)'. You don't need to memorize it, but use it to confirm your understanding of the logic we've developed.
Here is that same information presented in a more compact, visual matrix. This is a great tool to have in your mental toolkit.
Practice Problem
Let's apply this. Consider the market for electric vehicles (EVs). Suppose two things happen at once:
- A technological breakthrough significantly lowers the cost of batteries.
- Consumer preferences shift strongly in favor of environmentally friendly transportation.
What is the predicted effect on the equilibrium price and quantity of EVs? Take a moment to work through it using our three-step process before reading the solution.
. . .
Solution:
- Analyze Shift 1 (Lower battery cost): This reduces production costs, shifting the supply curve to the right. Effect: , .
- Analyze Shift 2 (Stronger consumer preference): This is a change in tastes, shifting the demand curve to the right. Effect: , .
- Combine Results:
- Quantity: Both shifts cause quantity to increase. The final effect is a definite increase in equilibrium quantity.
- Price: The supply shift pushes the price down, while the demand shift pushes it up. The final effect on price is indeterminate.
Conclusion
In this lesson, we tackled one of the more complex aspects of supply and demand analysis. By breaking down the problem systematically, we can confidently predict the outcomes of real-world events that often happen in tandem.
Here are our key takeaways:
- When both the supply and demand curves shift, the change in one equilibrium variable (price or quantity) will be certain, while the change in the other will be indeterminate.
- The best method for analysis is to consider each shift separately and then combine their effects on price and quantity.
- The outcome for the indeterminate variable depends on the relative magnitude of the two shifts.
So far, our analysis has been qualitative—we've focused on the direction of change (up, down, or indeterminate). In our next lesson, we will introduce a crucial quantitative concept: elasticity. This will allow us to measure how much quantity demanded responds to a change in price, adding a new layer of precision to our market analysis.