Recommended resources
The freely available resources this lesson will direct you to.
- Y1 14) Income Elasticity of Demand (YED)www.youtube.com
- Y1 13) Cross Elasticity of Demand (XED)www.youtube.com
- 4.1 Calculating Elasticity – Principles of Microeconomicspressbooks.bccampus.ca
- [PDF] Microeconomics: Elasticity & Total Revenue Testlearningcentre.vcc.ca
- Cross elasticity of demand | Elasticity | Microeconomics | Khan Academywww.youtube.com
- Demand Elasticities: Price Elasticity, Cross- Price Elasticity, and Income Elasticitywww.youtube.com
Hello! Welcome back to our course on economics.
In our previous lesson, we introduced the powerful concept of price elasticity of demand (PED), which measures how much the quantity demanded of a good responds to a change in its own price. We learned how to calculate it using the midpoint method and how to interpret the value to classify demand as elastic, inelastic, or unit elastic.
Today, we will build directly on that foundation. We know that factors other than a good's own price can shift the demand curve. This lesson explores how we can use elasticity to measure the impact of two of these key factors: changes in consumer income and changes in the prices of related goods.
Our learning outcome for this session is to calculate income elasticity and cross-price elasticity of demand. By the end of this lesson, you will be able to:
- Calculate and interpret cross-price elasticity to determine if goods are substitutes or complements.
- Calculate and interpret income elasticity to determine if goods are normal (necessities or luxuries) or inferior.
This will add significant depth to your understanding of what drives consumer behavior.
1. Cross-Price Elasticity of Demand: Substitutes and Complements
First, let's explore how the price of one product affects the demand for another. This relationship is captured by the cross-price elasticity of demand (E_xy). It measures how the quantity demanded of one good (Good X) responds to a change in the price of a different good (Good Y).
The formula is:
Unlike price elasticity of demand, the sign (positive or negative) of the cross-price elasticity is crucial. It tells us the relationship between the two goods.
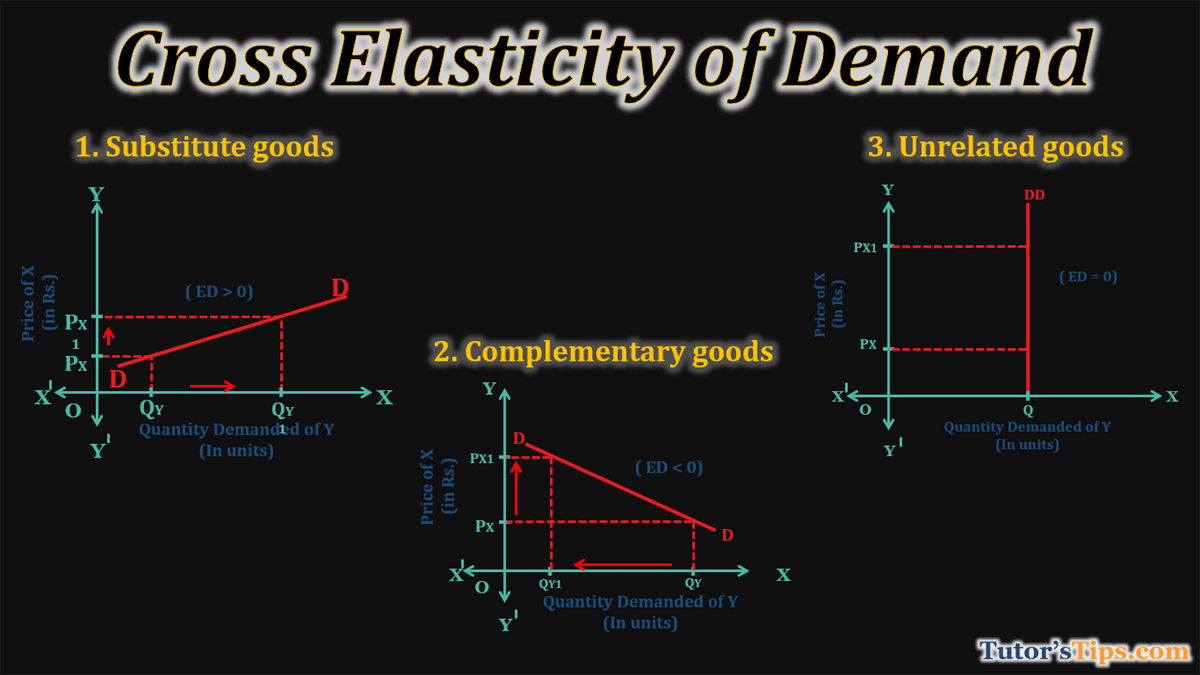
- If E_xy > 0 (Positive): The goods are substitutes. When the price of Good Y increases, consumers buy less of it and switch to buying more of Good X. (e.g., Coca-Cola and Pepsi).
- If E_xy < 0 (Negative): The goods are complements. When the price of Good Y increases, consumers buy less of it, and since the goods are used together, they also buy less of Good X. (e.g., smartphones and apps).
- If E_xy = 0: The goods are unrelated. A change in the price of Good Y has no effect on the demand for Good X. (e.g., milk and car tires).
The image below provides a great visual summary of these relationships.
To see how this is calculated and to build your intuition, let's watch a video that walks through some clear examples.
Cross elasticity of demand | Elasticity | Microeconomics | Khan Academy
This Khan Academy video provides an excellent explanation of cross-price elasticity. It uses the midpoint method for calculation, which is consistent with our last lesson, and provides intuitive examples involving competing airlines (substitutes) and e-readers/e-books (complements).
Watch the entire video (about 11 minutes). Pay close attention to how the sign of the final elasticity value determines whether the goods are substitutes or complements.
2. Income Elasticity of Demand: Normal and Inferior Goods
Next, let's examine how a change in consumer income affects the demand for a product. This is measured by the income elasticity of demand (E_i).
The formula is:
Just as with cross-price elasticity, the sign of the income elasticity is very important. It tells us whether a good is a normal good or an inferior good.
- If E_i > 0 (Positive): The good is a normal good. As income increases, consumers buy more of it.
- If 0 < E_i < 1, the good is a necessity. Demand increases as income rises, but less than proportionally (e.g., basic groceries, electricity).
- If E_i > 1, the good is a luxury. Demand increases as income rises, and more than proportionally (e.g., sports cars, foreign vacations).
- If E_i < 0 (Negative): The good is an inferior good. As income increases, consumers buy less of it, often switching to a better alternative (e.g., instant noodles, bus travel).
The following reading provides a clear, detailed explanation of these categories with examples.
This text from StudyPug clearly defines income elasticity of demand, presents the formula, and explains how to interpret the values to classify goods as normal (elastic/inelastic) or inferior.
Read the section titled 'Income Elasticity of Demand'. Focus on the distinction between normal and inferior goods, and the further breakdown of normal goods into luxuries and necessities based on the elasticity value.
3. Calculation and Practice
Now that we have the concepts, let's solidify the calculation process. The following guide provides a simple, step-by-step approach for both elasticities.
Calculating Elasticity: Step-by-Step Guide
This step-by-step guide is a practical summary of how to calculate both cross-price and income elasticity. It also highlights common mistakes to avoid.
Read the section titled 'Calculating Elasticity: Step-by-Step Guide'. This will serve as a quick reference for the formulas and process.
Practice Problem
Let's apply what you've learned. Consider the market for coffee shop lattes.
- Initially, the average price of a latte is $4.00, and 500 are sold per day.
- After a local marketing campaign increases average resident income by 5%, the quantity of lattes sold increases to 550 per day.
- Separately, the price of a cup of tea at a nearby cafe rises from $2.00 to $2.40. Following this, the quantity of lattes sold increases from 500 to 540 per day.
Your Task:
- Calculate the income elasticity of demand for lattes. Based on your result, are lattes a normal or inferior good? Are they a necessity or a luxury?
- Calculate the cross-price elasticity of demand for lattes with respect to the price of tea. Are lattes and tea substitutes or complements? (Use the midpoint method for this calculation).
Click to see the solution
1. Income Elasticity of Demand:
- Percentage change in income = 5% (given)
- Percentage change in quantity demanded:
- Change in Qd = 550 - 500 = 50
- Using the initial quantity as the base: (%ΔQd) = (50 / 500) * 100 = 10%
- Income Elasticity (E_i):
- Interpretation: Since (which is positive and greater than 1), lattes are a normal good and are considered a luxury. A 1% increase in income leads to a 2% increase in demand.
2. Cross-Price Elasticity of Demand:
- Percentage change in quantity demanded of lattes (midpoint method):
- %ΔQd = [(540 - 500) / ((540 + 500)/2)] * 100 = [40 / 520] * 100 ≈ 7.69%
- Percentage change in price of tea (midpoint method):
- %ΔP = [(2.40 - 2.00) / ((2.40 + 2.00)/2)] * 100 = [0.40 / 2.20] * 100 ≈ 18.18%
- Cross-Price Elasticity (E_xy):
- Interpretation: Since (which is positive), lattes and tea are substitutes. When the price of tea rises, people switch to buying more lattes.
4. A More Formal Approach
Given your analytical background, you might appreciate seeing how these concepts are applied in a more formal economic model. Often, demand is represented by a linear equation. This next video shows how to calculate elasticities directly from such an equation.
Demand Elasticities: Price Elasticity, Cross- Price Elasticity, and Income Elasticity
This video from 'Economics in Many Lessons' demonstrates how to calculate all three elasticities (price, cross-price, and income) from a linear demand function. This approach is common in economic modeling and should resonate with your quantitative skills.
Watch the video from 1:52 to 4:30 and from 7:04 to 8:21. The first part explains the general formulas using coefficients from a demand equation. The second part shows the specific calculation for cross-price and income elasticity using a numerical example. You can think of 'taking the partial derivative' as simply 'taking the coefficient' of the variable you are interested in.
This method shows that the coefficients on income and the prices of other goods in a demand function hold important information about consumer behavior, which we can unlock using the tools of elasticity.
Conclusion
In this lesson, we expanded our understanding of elasticity beyond just the price of the good itself. By measuring how demand responds to other economic factors, we can build a much richer picture of consumer choice.
Here are our key takeaways:
- Cross-Price Elasticity of Demand measures how the demand for one good changes with the price of another. A positive value indicates substitutes, while a negative value indicates complements.
- Income Elasticity of Demand measures how demand changes with consumer income. A positive value indicates a normal good (a necessity if < 1, a luxury if > 1), and a negative value indicates an inferior good.
- The calculation for both elasticities relies on the same principle of dividing the percentage change in quantity by the percentage change in the relevant variable (another price or income).
In our next lesson, we will shift our focus from the demand side to the supply side of the market. We will explore the price elasticity of supply, which measures how responsive producers are to changes in the market price.