Recommended resources
The freely available resources this lesson will direct you to.
Welcome back. In our previous lesson, we analyzed the company's financial stability by calculating liquidity and solvency ratios from the Bilan (Balance Sheet). You learned how to assess a company's ability to meet its short-term and long-term obligations.
Today, we shift our focus from stability to performance. Our goal is to calculate and interpret key profitability ratios. These ratios answer the fundamental question: "How successful is the business at generating profit from its operations and investments?" We will primarily use data from the Compte de Produits et Charges - CPC (Income Statement) and connect it back to the Bilan.
By the end of this lesson, you will be able to measure a company's profitability at different levels and understand how efficiently it uses its resources to create value for its owners.
Part 1: Profitability Margins – From Sales to Net Profit
Profitability analysis often begins by looking at margins. A margin ratio expresses a level of profit as a percentage of sales (Chiffre d'Affaires). It tells you how many centimes of profit the company keeps for every dirham of revenue.
To get a clear overview of the key margins, please watch the first two minutes of the following video. It explains Gross, Operating, and Net Profit Margins, which correspond directly to key lines on the Moroccan CPC.
Profitability Ratios: Gross, Operating & Net Profit Margin Explained
This video from the Corporate Finance Institute provides a clear and concise explanation of the three fundamental profitability margins.
Watch from the beginning up to the 02:09 mark. Pay attention to how each margin is calculated and what it represents in terms of the company's cost structure.
As the video explained, we analyze profitability at three key levels:
-
Gross Profit Margin (
Taux de Marge Brute): This measures the profitability of the core product or service itself, before any other operating expenses are considered.- Formula:
- Where
Marge Brute=Ventes de marchandises (en l'état)-Achats revendus de marchandises. - Interpretation: It shows the efficiency of the production or purchasing process. A high gross margin means the company has a healthy markup on its goods.
-
Operating Profit Margin (
Taux de Marge d'Exploitation): This measures the profitability of the company's entire primary business operations. It shows what's left after paying for both the cost of goods and all other operational expenses (salaries, rent, marketing, etc.).- Formula:
- Interpretation: This is a crucial indicator of a company's core operational efficiency. A strong operating margin indicates a well-managed business.
-
Net Profit Margin (
Taux de Marge Nette): This is the "bottom line." It represents the percentage of revenue remaining after all expenses, including financial costs (interest) and taxes, have been deducted.- Formula:
- Interpretation: This is the ultimate measure of profitability. It tells you exactly how much profit the company makes for every dirham of sales.
To deepen your understanding of the most important of these margins, the net profit margin, please read the following text.
Net Profit Margin: Definition, Purpose, Formula, Calculation ...
This article, 'Net Profit Margin', provides a detailed look at what the net profit margin indicates about a company's efficiency and competitive position.
Read the sections titled 'What is the net profit margin?', 'What is the purpose of net profit margin?', and 'What does net profit margin indicate?'. Focus on understanding why this ratio is so important for evaluating a company's overall health and management effectiveness.
As the article highlights, a higher net profit margin is generally better, but context is everything. It must be compared to the company's past performance (trend analysis) and to its competitors (industry benchmarking). A software company will naturally have a much higher net profit margin than a grocery supermarket, which operates on high volume and thin margins.
Test your understanding!
An SME in Morocco has the following simplified CPC data:
- Chiffre d'Affaires (Revenue): 2,000,000 DH
- Résultat d'Exploitation (Operating Income): 300,000 DH
- Résultat Net (Net Income): 150,000 DH
Calculate the Operating Profit Margin and Net Profit Margin. What does the difference between these two margins tell you?
Show answer
- Operating Profit Margin: or 15%
- Net Profit Margin: or 7.5%
The difference of 7.5% (15% - 7.5%) represents the portion of revenue consumed by non-operating items, specifically financial charges (like interest on debt) and corporate income tax (Impôt sur les Sociétés). In this case, for every dirham of sales, 7.5 centimes were used to pay lenders and the government.
Part 2: Return on Equity (ROE) – The Investor's Perspective
While margins measure profitability relative to sales, Return on Equity (ROE) or Rentabilité des Capitaux Propres measures profitability relative to the owner's investment. It answers the question: "How effectively is the company using the money invested by its owners to generate profit?"
This is arguably one of the most important financial ratios for owners and investors.
How & Why to Calculate Return on Equity (ROE) - HBS Online
This article from Harvard Business School Online, 'How & Why to Calculate Return on Equity (ROE)', explains the concept, its calculation, and how to interpret it.
Read the sections 'What Is Return on Equity (ROE)?' and 'How to Calculate Return on Equity (ROE)'. Pay close attention to the basic formula and the reasoning for using 'Average Equity' for a more accurate calculation.
The basic formula is straightforward:
- Résultat Net (Net Income) comes from the
CPC. - Capitaux Propres (Shareholders' Equity) comes from the
Bilan.
An ROE of 20% means that for every 100 DH of equity the owners have in the company, the business generated 20 DH of net profit during the period.
Decomposing ROE: The DuPont Formula
A high ROE is good, but why is it high? Is it because the company has great profit margins? Or is it because it uses its assets very efficiently? Or is it taking on a lot of debt?
To answer this, we can use the DuPont formula, which breaks down ROE into three key components. The video you watched earlier introduced this concept, and the HBS article provides further detail.
How & Why to Calculate Return on Equity (ROE) - HBS Online
Let's revisit the HBS article to understand the powerful DuPont formula.
Read the section 'The DuPont Formula: Decomposing ROE'. Focus on understanding the three components and how they multiply together to form ROE.
The DuPont analysis shows that:
ROE = (Net Profit Margin) x (Asset Turnover) x (Financial Leverage)
Let's break this down:
-
Profitability (Net Profit Margin):
Résultat Net / Chiffre d'Affaires- Measures how much profit is generated from each dirham of sales. We've already covered this.
-
Efficiency (Asset Turnover):
Chiffre d'Affaires / Total Actif- Measures how efficiently the company uses its assets to generate sales. A higher number means more sales are being "squeezed" out of each dirham of assets.
-
Leverage (Financial Leverage):
Total Actif / Capitaux Propres- Measures the extent to which the company uses debt to finance its assets. A higher number indicates more debt relative to equity. Using debt can amplify returns (and losses).
This decomposition is a powerful diagnostic tool. If a company's ROE increases, an accountant can use DuPont analysis to determine if it was due to improved margins, better asset efficiency, or taking on more debt—each of which tells a very different story about the company's strategy and risk profile.
Part 3: Summary and Practical Application
As an accountant, you will regularly calculate and present these ratios. It is useful to have a summary sheet for reference.

Remember, the real insight comes from analyzing trends over time. Look at the following example.
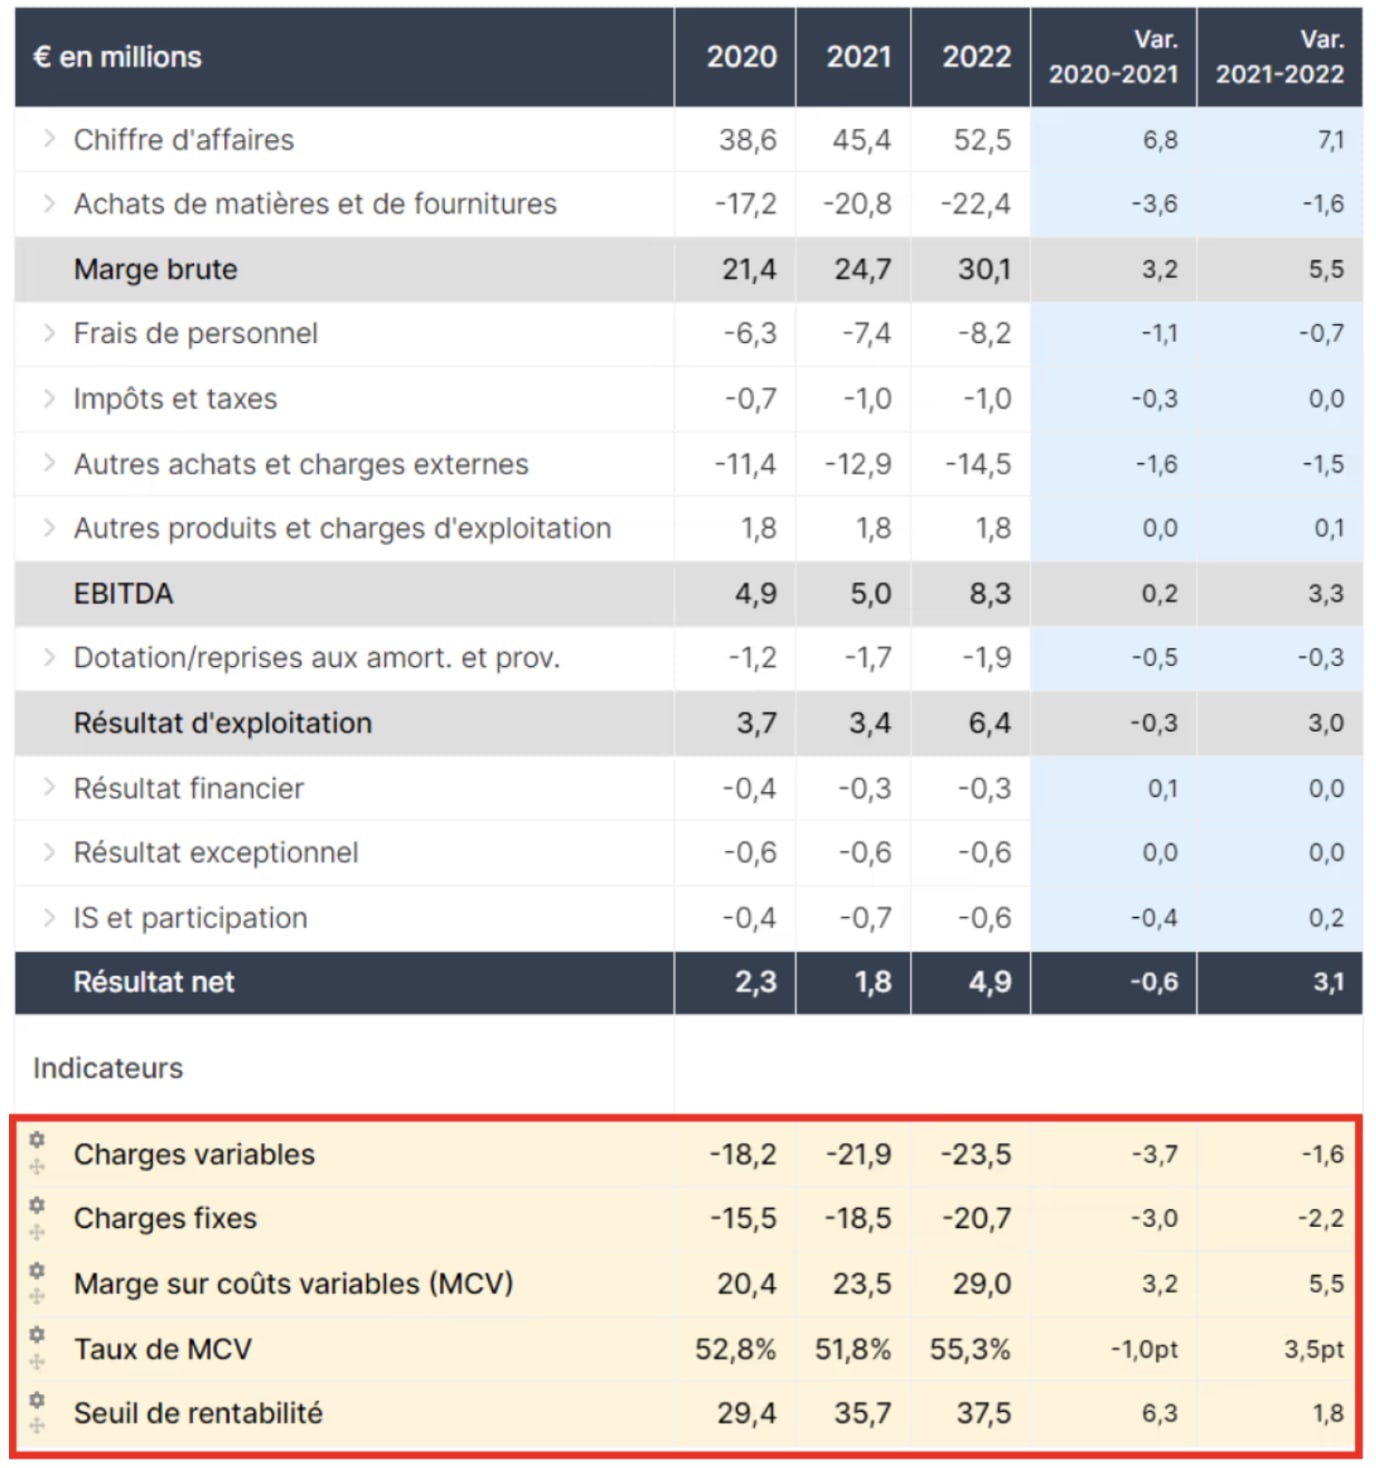
An accountant looking at this table might observe: "While our revenue (Chiffre d'affaires) grew steadily from 2020 to 2022, our Net Income (Résultat net) took a dip in 2022. Our Gross Margin (Marge brute) remained relatively stable. This suggests that the pressure on profitability in 2022 came from an increase in operating or financial expenses, not from our core cost of goods." This is the kind of value-added analysis that management needs.
Conclusion
In this lesson, we have added a crucial set of tools to your analytical toolkit. You have moved beyond preparing statements to interpreting the story they tell about a company's performance.
Key Takeaways:
- Profitability Margins (Gross, Operating, and Net) measure a company's ability to convert sales into profit at different stages of its operations.
- Net Profit Margin is the ultimate measure of profitability from sales, showing the percentage of revenue that becomes bottom-line profit.
- Return on Equity (ROE) is a key indicator for owners, measuring how effectively their investment is being used to generate profit.
- The DuPont formula deconstructs ROE into profitability, efficiency, and leverage, providing deep insight into the drivers of shareholder return.
- The interpretation of ratios is meaningless in isolation. It requires trend analysis (comparison over time) and benchmarking (comparison against industry peers).
Preview of the Next Lesson:
We have now covered the Bilan and the CPC. However, there is one more core financial statement: the Statement of Cash Flows. A company can be profitable on paper but fail due to a lack of cash. In our next lesson, we will explore the purpose and structure of the Statement of Cash Flows, learning how to track the actual movement of cash in and out of a business.