Recommended resources
The freely available resources this lesson will direct you to.
Welcome back. In the previous lesson, we accomplished a crucial task: preparing a complete, classified Bilan (Balance Sheet) from an adjusted trial balance. You learned how to structure the Actif and Passif and ensure the fundamental accounting equation, Total Actif = Total Passif, holds true.
Now that we can construct the Bilan, our focus shifts to interpretation. A financial statement is only useful if it can tell a story about the company's health. Today, our objective is to calculate and interpret key liquidity and solvency ratios. These ratios are fundamental analytical tools that transform raw numbers from the Bilan into powerful insights about a company's ability to meet its financial obligations.
We will explore two critical dimensions of financial health:
- Liquidity: The ability to pay short-term debts as they come due.
- Solvency: The ability to pay all debts, both short-term and long-term, ensuring long-term survival.
Conceptual Foundation: Liquidity vs. Solvency
Before we calculate any numbers, it's essential to understand the conceptual difference between liquidity and solvency. A company can be solvent but not liquid, leading to a "cash crunch" even if it owns valuable assets.
To grasp this distinction intuitively, please watch the first part of the following video. It uses a simple but effective metaphor to differentiate between being solvent (having enough assets) and being liquid (having assets that can be quickly converted to cash).
Watch this introductory segment from The Finance Storyteller to understand the core difference between solvency and liquidity.
Watch from the beginning until 02:29. Focus on the water glass metaphor and how it illustrates the difference between possessing assets and having accessible cash.
As the video explains:
- Solvency is about the state of your balance sheet. Do your total assets exceed your total liabilities? If yes, you are solvent.
- Liquidity is about your cash flow. Can you convert your assets into cash quickly enough to pay your immediate bills? If yes, you are liquid.
An otherwise healthy company that cannot pay its suppliers or employees because its cash is tied up in non-liquid assets is facing a liquidity crisis. An accountant's role includes monitoring both aspects to provide a complete picture of financial stability.
Calculating and Interpreting Liquidity Ratios
Liquidity ratios measure a company's ability to meet its obligations over the next year. They compare short-term assets to short-term liabilities. We will use the corrected Bilan from our previous lesson as our case study.
Bilan (Corrected and Simplified)
| ACTIF | Montant (Net) | PASSIF | Montant |
|---|---|---|---|
| Actif Immobilisé | 88,704 | Financement Permanent | 150,000 |
| Actif Circulant (Hors Trésorerie) | 77,000 | Passif Circulant (Hors Trésorerie) | 94,704 |
| Dont Stocks: 35,000 | |||
| Dont Créances Clients: 42,000 | |||
| Trésorerie - Actif | 79,000 | Trésorerie - Passif | 0 |
| TOTAL ACTIF | 244,704 | TOTAL PASSIF | 244,704 |
1. Current Ratio (Ratio de trésorerie générale)
This is the most common liquidity ratio. It answers the question: "For every dirham of debt due in the next year, how many dirhams of short-term assets do we have?"
-
Formula:
-
Calculation:
-
Interpretation:
A ratio of 1.65 means the company has 1.65 DH of current assets for every 1 DH of current liabilities.- Benchmark: Generally, a ratio greater than 1 is considered safe. A value between 1.5 and 2 is often seen as healthy.
- Our Company: At 1.65, the company appears to be in a good position to cover its short-term debts.
2. Quick Ratio (Ratio de trésorerie réduite or Acid-Test)
This is a stricter liquidity test because it excludes inventory (stocks) from current assets. Inventory can sometimes be difficult to sell quickly without a significant price reduction.
-
Formula:
-
Calculation:
-
Interpretation:
A ratio of 1.28 means the company has 1.28 DH of liquid assets (excluding inventory) for every 1 DH of current liabilities.- Benchmark: A ratio greater than or equal to 1 is generally considered very healthy.
- Our Company: The company can cover all its short-term liabilities without needing to sell a single item from its inventory, which indicates a strong liquidity position.
Test your understanding!
A competitor has a Current Ratio of 2.5 but a Quick Ratio of 0.8. What does this combination likely tell you about their business?
Show answer
This combination suggests that the competitor is heavily reliant on its inventory. A high Current Ratio (2.5) looks good on the surface, but the low Quick Ratio (0.8) reveals that if you exclude inventory, they cannot cover their short-term debts. They might have too much slow-moving or obsolete stock, posing a significant liquidity risk.
Calculating and Interpreting Solvency Ratios
Solvency ratios assess a company's long-term health and its ability to survive over time. They primarily focus on the level of debt used to finance the business.
1. Debt-to-Equity Ratio
This ratio compares the total amount of debt (from creditors) to the amount of capital invested by the owners. It measures the company's financial leverage.
-
Formula:
Total des Dettes = Dettes de Financement (Long-term) + Passif Circulant (Short-term)
-
Calculation:
From ourBilan: Capitaux Propres = 100,000; Dettes de Financement = 50,000; Passif Circulant = 94,704. -
Interpretation:
A ratio of 1.45 means the company has 1.45 DH of debt for every 1 DH of equity.- Benchmark: There is no single ideal ratio; it varies greatly by industry. However, a higher ratio generally means more risk for creditors and the company itself, as it relies more heavily on borrowed money.
- Our Company: Creditors have a larger claim on the company's assets than its owners. While not necessarily bad, it indicates a significant level of leverage.
2. Financial Autonomy Ratio (Ratio d'autonomie financière)
This is a common ratio in Moroccan financial analysis that looks at solvency from a different angle. It measures the proportion of permanent financing that comes from the owners' equity.
-
Formula:
Financement Permanent = Capitaux Propres + Dettes de Financement
-
Calculation:
-
Interpretation:
A ratio of 0.67 (or 67%) means that 67% of the company's stable, long-term capital comes from its owners.- Benchmark: A ratio above 0.50 (50%) is generally considered a sign of good financial autonomy and lower long-term risk.
- Our Company: The company is on solid ground, as its long-term financing is primarily secured by its owners rather than long-term lenders.
Summary of Key Ratios
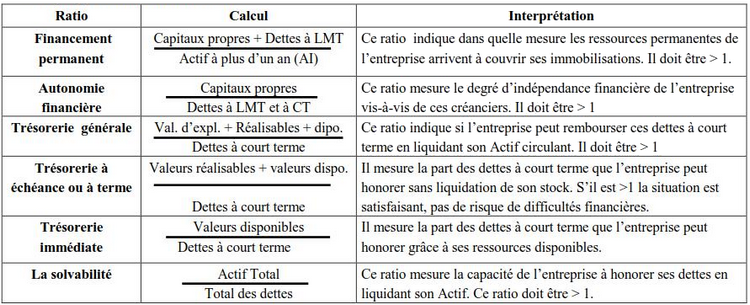
The following image provides a helpful summary of common financial ratios, including their formulas and standard interpretations in French. It's a useful reference to keep on hand as you practice financial analysis.
Bringing It All Together: A Practical Perspective
Ratios are not just academic exercises. As demonstrated in the JC Penney case study mentioned in the video resource, a trend of deteriorating ratios over several years is a clear warning sign. For instance, continuous losses erode equity, causing the Debt-to-Equity ratio to skyrocket. This signals that the company is becoming increasingly fragile and reliant on debt, a path that often leads to insolvency.
As an accountant for a Moroccan SME, you would calculate these ratios periodically (e.g., quarterly or annually) and present them to management. You wouldn't just state the numbers; you would explain what they mean in the context of the business and flag any worrying trends.
For example, a report might state: "Our liquidity is strong, with a Current Ratio of 1.65. However, our reliance on debt has increased, as shown by a Debt-to-Equity ratio of 1.45. We should monitor our debt levels to ensure long-term stability."
Conclusion
In this lesson, you have learned to move beyond just preparing financial statements to actively interpreting them. You can now calculate and understand some of the most fundamental indicators of a company's financial health.
Key Takeaways:
- Liquidity (short-term health) and Solvency (long-term health) are distinct but related concepts.
- The Current Ratio and Quick Ratio are key measures of a company's ability to pay its immediate bills.
- The Debt-to-Equity Ratio and Financial Autonomy Ratio measure a company's leverage and its ability to meet long-term obligations.
- Interpreting ratios involves comparing them to established benchmarks and, more importantly, tracking their trends over time.
Preview of the Next Lesson:
We have focused today on ratios derived from the Bilan. But what about performance and profitability? In our next lesson, we will calculate and interpret key profitability ratios, such as net profit margin. This will involve using data from the CPC (Income Statement) to assess how effectively the company is generating profit from its sales and assets.