Recommended resources
The freely available resources this lesson will direct you to.
- How to Master Support & Resistance Levels (All You Need to Know)www.youtube.com
- The Power of the Role Reversal - Technical Tuesday with AJ Monte CMTwww.youtube.com
- John Murphy's "Charting Made Easy" eBook | ChartSchool | StockCharts.comchartschool.stockcharts.com
- Support & Resistance - ChartSchool - StockCharts.comchartschool.stockcharts.com
Hello! Last lesson, you marked support and resistance as evidence-based zones. Keep those original bands on your chart: they let you judge a break without moving the boundaries afterward to fit what price did.
This lesson examines role reversal. You will learn when a completed move beyond resistance makes that former resistance a candidate for support, and when a move below support makes it a candidate for resistance. The distinction between a candidate and an observed response matters for position analysis. Allow about 35–40 minutes, including chart study.
Why a familiar zone can change roles
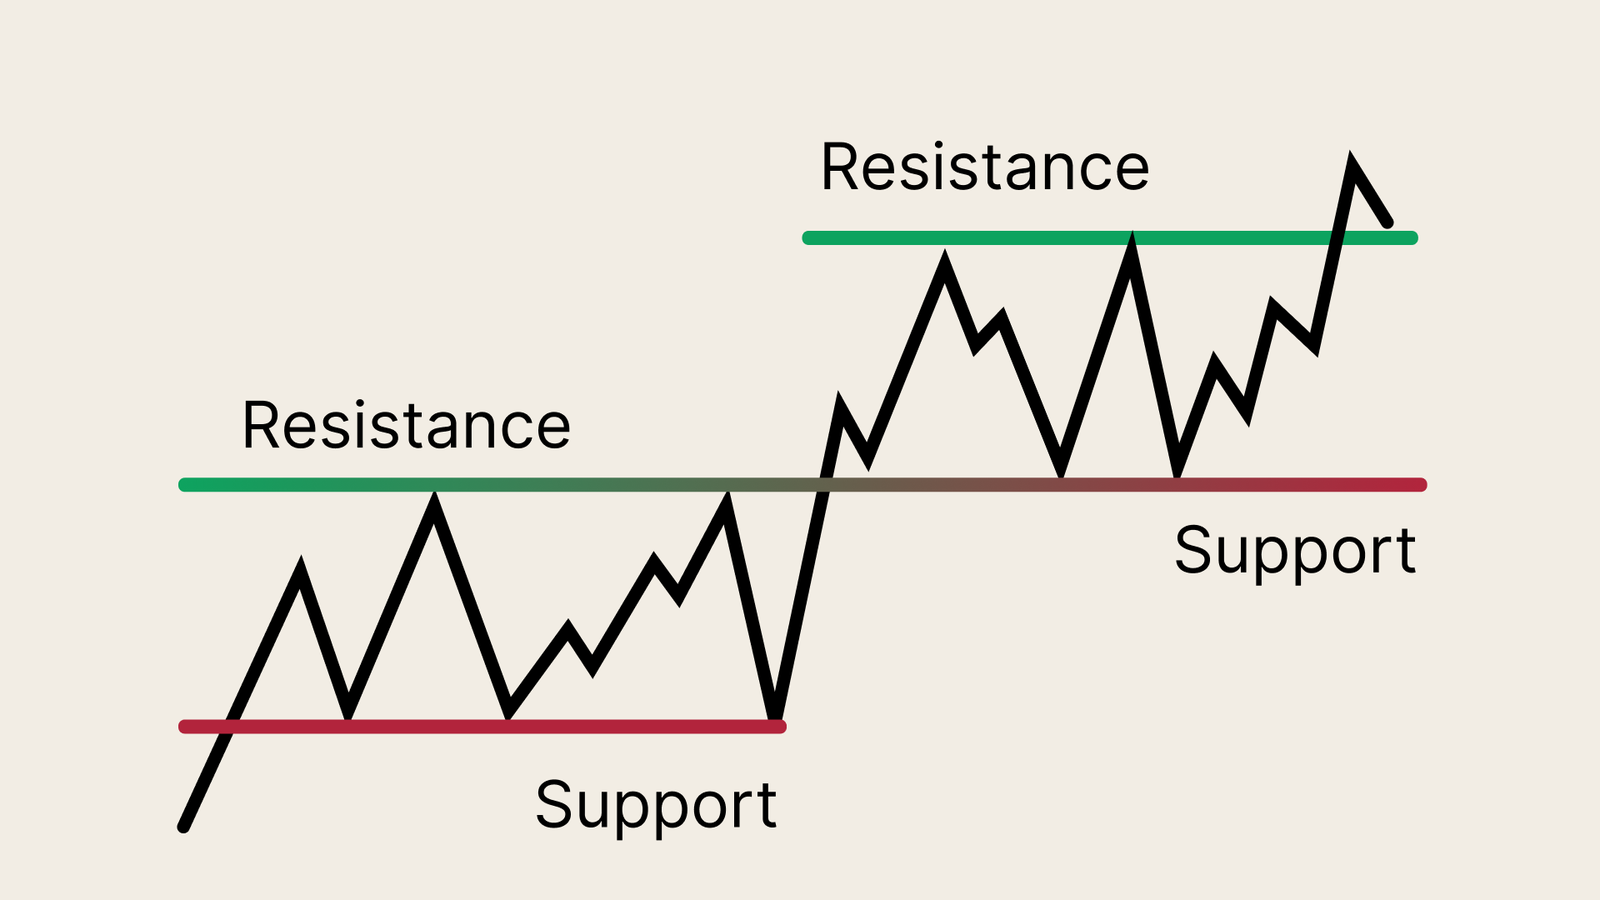
John Murphy states the principle plainly: support and resistance can reverse roles once decisively broken. The price area does not move; its position relative to the market changes. A resistance zone that was overhead is below price after an upward break. A support zone that was beneath price is overhead after a downward break.
John Murphy's "Charting Made Easy" eBook | ChartSchool | StockCharts.com
Read Murphy’s explanation because it gives the principle in the charting framework used throughout this course.
In “Support and Resistance Trendlines and Channels,” find the paragraph immediately below Figure 4-1. Read from the sentence beginning “Support and resistance levels reverse roles once they are decisively broken” through Murphy’s explanation. Look at Figure 4-2, “Role Reversal,” just below it. Stop before the paragraph beginning “The trendline is perhaps the simplest.”
A break suggests that the balance of buying and selling around the zone has changed. It does not establish that every later visit will produce a turn. The original band gives you somewhere specific to observe the market’s response; the response itself supplies the next piece of evidence.
This schematic shows an upward break. Notice that the old resistance does not disappear when price rises past it: the same area is shown beneath later price movement as support. The drawing uses lines for clarity; on your charts, retain the bands you marked from actual reactions.
Decide whether the break has completed
Suppose the weekly resistance band you marked previously is ₹348–₹351. During one week, price trades at ₹354 but closes at ₹349. It crossed the top of the band during the week, yet finished back inside it. Calling the old resistance “new support” would be premature.
Now suppose a subsequent weekly candle closes at ₹355, above the band’s upper edge. That is a completed weekly move beyond the zone. You can label ₹348–₹351 former resistance; possible support on a return. You cannot yet label it support confirmed by a retest, because price has not returned to show how it responds there.
Use this sequence when reading either direction:
- Keep the pre-existing zone. Its boundaries should come from the earlier reaction highs or lows, not from the later break.
- Specify the chart period. A completed daily close beyond a zone is daily evidence. If your principal zone is weekly, check the weekly close before describing a weekly break.
- Check the close against the far edge. For an upward break, look for a close above the resistance band’s upper edge; for a downward break, a close below the support band’s lower edge.
- Treat the new role as a hypothesis until tested. A later return can strengthen or weaken it. A return is not required for a break to have occurred.
This is a practical way to avoid confusing a brief penetration with a completed break, not a universal rule that one close guarantees success. We will examine breakout quality— including volume and follow-through—in a later module. For now, separate what closed beyond the zone from what the zone did afterward.
Watch the return, not an exact touch
Following the close at ₹355, imagine price rises further, then pulls back. It trades down to ₹350, within the old ₹348–₹351 band, closes at ₹353, and subsequently advances. That sequence offers evidence that former resistance has acted as support. Price did not have to touch ₹348, and the band did not need to repel every intraday trade.
The opposite case uses the same reasoning. Suppose the previously marked ₹310–₹316 support band is followed by a weekly close at ₹306. The break has put the old support above price. If a later rally reaches ₹312, finishes at ₹308, and then declines, the response supports calling ₹310–₹316 former support now acting as resistance. For a long-only position plan, that overhead area is a reason for caution, not an instruction to take a short trade.
The short video makes the downward case visible, particularly the difference between a return to an area and a perfect touch of a line.
How to Master Support & Resistance Levels (All You Need to Know)
Watch the selected excerpts from Brad Goh’s “How to Master Support & Resistance Levels” to see a broken support area approached from below.
In the first example, identify the support reactions, the break, and the later approach from below. Then watch the zone retest; focus on why rejection within the former support area counts as a test even without an exact-price touch. Treat the depicted retests as observations, not a promise that every break will retest or reverse.
Why might selling appear there? StockCharts describes one possible source: buyers who acquired shares around the old support may seek to sell when a rebound brings price back near their purchase area. Its examples also show the upward case, where a market returns to an old resistance area from above.
Support & Resistance - ChartSchool - StockCharts.com
Read ChartSchool’s “Support Equals Resistance” subsection for the two directions of role reversal and an explanation of the potential selling at former support.
In “Support Equals Resistance,” begin with “Another principle of technical analysis stipulates that support can turn into resistance and vice versa.” Read the explanation beginning with both directions, then inspect the NASDAQ 100 and PeopleSoft chart examples immediately below it. Continue through the paragraph beginning “Where does”. Stop before the “Trading Range” subsection. As you inspect each chart, distinguish the initial break from the later test of the old area.
This account explains a possible market response rather than proving what any particular holder intends to do. What you can observe is the sequence of prices: the old zone, the completed break, the return, and whether price turns away or moves back through it.
When the proposed new role does not hold
Role reversal is useful only if you allow contrary evidence to count. In the ₹348–₹351 example, suppose price closes at ₹355 but soon falls back and closes at ₹345, below the old resistance band. That is evidence against the claim that the band is currently holding as new support. Do not widen it after the fact to include ₹345 or continue calling the test successful merely because the earlier breakout happened.
Likewise, after a close below ₹310–₹316, a rebound that closes at ₹318, above the former support band, challenges the idea that it is holding as new resistance. One contrary close does not explain the stock’s entire future trend. It does tell you to revise the specific claim that the old zone is currently controlling the return.
A useful chart annotation keeps those judgments separate:
Original evidence: weekly resistance ₹348–₹351 from earlier reaction highs.
Break: weekly close ₹355 above the band.
Return: price reached ₹350, closed back above the band, then advanced.
Assessment: former resistance has shown support on this test; watch whether subsequent price behavior remains consistent with it.
If the return has not happened, the final line should instead say “possible support; untested.” This wording prevents a chart label from claiming more than price has shown.
On your TradingView layout, spend about 10–12 minutes reviewing one previously marked zone on an NSE-listed stock. Keep the adjusted-price setting consistent. Locate the first completed daily or weekly close beyond the band, record its date and closing price, and then inspect any later return. If there is no completed break, leave the zone’s original role unchanged. If there is a break but no return, record the proposed new role as untested. Avoid shifting the rectangle while reviewing subsequent candles.
Where this leaves you
A completed break changes how you should watch a zone; a later response shows whether its new role has evidence behind it. Above broken resistance, look for possible support on a return. Below broken support, look for possible resistance. Judge the return against the original band, not an exact-price touch, and withdraw the claim if price moves convincingly back through it.
Next, you will use confirmed price pivots to draw a trendline. Unlike today’s horizontal zones, that line will follow the direction of successive swings—without being forced to fit every candle.