Recommended resources
The freely available resources this lesson will direct you to.
Introduction
In our last lesson, you successfully implemented gradient descent from scratch for linear regression. A key part of that exercise was experimenting with the learning_rate hyperparameter, where you likely observed that its value dramatically influences the training process. A small learning rate led to slow convergence, while a large one caused the cost to behave erratically or even diverge.
Today, we will formalize this empirical understanding. Our objective is to explain the fundamental role of the learning rate and equip you with the tools to diagnose its effects on convergence. We will move beyond simple intuition to explore the mathematical reasons for its behavior, connecting it back to the Taylor series approximation that underpins gradient descent and even to second-order information about the loss function's curvature. We will also touch upon the theoretical guarantees of convergence, a topic that should appeal to your interest in systems performance.
The Role of the Learning Rate
Let's start by revisiting the gradient descent update rule:
We use (eta) here for the learning rate, which is equivalent to the we've used previously. It is a scalar hyperparameter that controls the magnitude of the step we take in the direction opposite to the gradient.
The gradient, , gives us the direction of steepest ascent on the loss surface. By moving in the opposite direction, we are performing the method of steepest descent. The learning rate, , determines how far we travel in that direction.
To build a strong mental model, let's watch a brief video that visualizes this process and its connection to the mathematics we've discussed.
Gradient Descent | Neural Networks
The video "Gradient Descent | Neural Networks" from First Principles of Computer Vision provides an excellent derivation and visualization.
Please watch the following segments: The derivation: This part recaps how the change in cost, \Delta C, is approximated by the dot product of the gradient and the change in parameters, \Delta \mathbf{v}. This directly relates to the first-order Taylor approximation we've studied. The update rule: This is where the learning rate \eta is introduced to scale the step, defining the update \Delta \mathbf{v} = -\eta \nabla C. The effect of eta: This segment visually demonstrates the consequences of choosing a small, optimal, or large learning rate.
Diagnosing the Effects of the Learning Rate
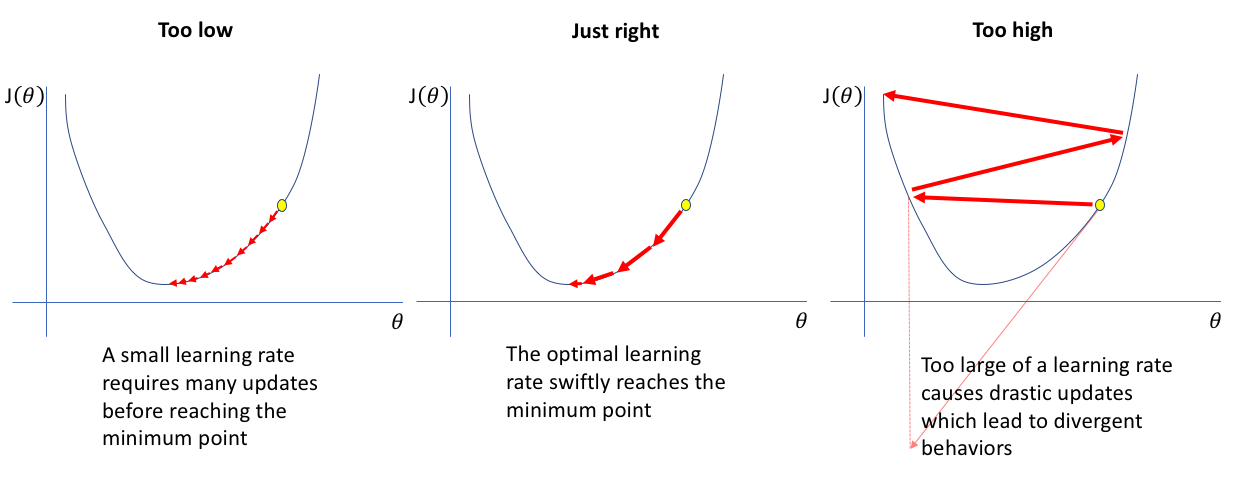
The video provides a clear visual intuition. A small results in tiny, cautious steps, leading to slow but steady progress. A large causes drastic updates that can overshoot the minimum, leading to oscillations or even divergence where the loss increases with each step. An optimal finds a balance, converging quickly and efficiently.
The image below, "The effect of learning rate," illustrates these three scenarios on a simple 1D quadratic loss function. The x-axis is the parameter value , and the y-axis is the cost .
In practice, the most common way to diagnose the effect of the learning rate is by plotting the loss function value at each iteration, just as you did in the previous lesson's coding exercise.

These plots are your primary diagnostic tool:
- Loss diverges (goes up): Your learning rate is too high. Decrease it significantly (e.g., by a factor of 10).
- Loss oscillates wildly: Your learning rate is still too high. Decrease it (e.g., by a factor of 3).
- Loss decreases very slowly: Your learning rate is likely too low. Try increasing it (e.g., by a factor of 3).
- Loss decreases steadily: You're in a good range. You might experiment with slightly larger values to see if you can converge faster.
A Deeper Look: The Learning Rate and Curvature
Now, let's move to a first-principles explanation. Why does "too high" cause divergence? Recall that the gradient descent rule is derived from a first-order Taylor approximation:
This is a linear approximation of a likely non-linear function. This approximation is only accurate in a small neighborhood around . The learning rate controls the size of this neighborhood. If is too large, our step takes us so far from that the linear approximation is no longer valid, and there is no guarantee that the loss will decrease.
We can gain even deeper insight by considering second-order information—the curvature of the loss function, captured by the Hessian matrix. For a simple 1D quadratic function , the first derivative (gradient) is and the second derivative (curvature) is .
My question to you is: For this function , what would be the exact learning rate that allows you to reach the minimum at in a single step, starting from any point ?
Let's analyze this. The update rule is . We want .
For this to hold for any , we must have , which implies .
This is a profound result: the optimal learning rate is the inverse of the function's curvature.
- High curvature (steep bowl, large ): We need a small learning rate.
- Low curvature (shallow bowl, small ): We need a large learning rate.
Since the loss surface of a neural network is highly complex and non-uniform, the local curvature changes from point to point. A fixed learning rate is therefore always a compromise.
This next reading explores this exact idea with concrete numerical examples.
Why exactly do we need the learning rate in gradient ...
This StackExchange answer provides an excellent mathematical explanation connecting the learning rate to second-order information.
Please read the two answers provided by the user nbro. Focus on the following sections within their second, more detailed answer: Start at the short answer. This section formally connects the learning rate to the second derivative from the Newton-Raphson algorithm and shows how the optimal learning rate \alpha^* is related to the curvature for two different quadratic functions. Continue with the two bullet points demonstrating what happens with non-optimal rates. This provides concrete numerical examples of slow convergence and divergence, reinforcing the core concepts.
Convergence Rate Analysis
For someone with your background in engineering and performance, it's not enough to know that it converges; you should also ask how fast it converges. This is the domain of optimization theory.
Under certain assumptions, we can provide a formal guarantee on the convergence rate of gradient descent. A key assumption is that the gradient of the loss function is L-Lipschitz continuous. This is a mathematical way of saying the function's curvature is bounded. Formally, there exists a constant such that for any two points and :
If we set the learning rate , we can guarantee that the loss will not increase. Furthermore, we can derive a bound on how quickly the algorithm converges. For a general non-convex function (the standard case in deep learning), it can be shown that after iterations, the minimum squared gradient norm found so far is bounded:
where is the initial loss and is the minimum possible loss.
This is called a sublinear convergence rate. It means that to guarantee a solution with an error tolerance of (i.e., ), we need iterations. This formalizes the diminishing returns you see in the loss plot: each additional "digit of accuracy" requires exponentially more work.
The following resource provides the derivation and discussion of this important result.
Convergence of Gradient Descent
These lecture slides from Mark Schmidt at UBC provide a rigorous analysis of gradient descent's convergence rate.
Please review the following parts of the slides: Read the section "Convergence Rate of Gradient Descent" (pages 7-9) to understand the setup and key ideas. Skim the derivation on pages 10-12, focusing on the final result: the O(1/t) bound. Read the discussion on pages 14 and 18, particularly the definitions of sublinear, linear, and superlinear rates. This will clarify what O(1/t) means in practice.
Conclusion
In this lesson, we have moved from an empirical observation to a formal understanding of the learning rate. You are now equipped to not only select this hyperparameter but also to explain its function from first principles.
Key Takeaways:
- Role of : The learning rate is a hyperparameter that scales the gradient update, controlling the step size in our descent on the loss surface.
- Diagnostic Tool: Plotting the loss versus iterations is the primary method for diagnosing the learning rate's effect. Divergence or oscillation indicates a rate that is too high, while slow progress indicates a rate that is too low.
- Connection to Curvature: The optimal learning rate is inversely proportional to the local curvature of the loss function. Since this curvature is not constant, a fixed learning rate is a compromise.
- Convergence Guarantee: Under the assumption of L-Lipschitz continuity, gradient descent has a guaranteed sublinear convergence rate of , meaning the number of iterations required scales as for a desired accuracy .
Preview of the Next Lesson:
So far, our gradient has been calculated using the entire dataset. This is known as Batch Gradient Descent. For modern datasets with millions or billions of samples, computing this at every step is computationally infeasible. In our next lesson, we will derive Stochastic Gradient Descent (SGD), a powerful and scalable alternative that approximates the gradient using only a small subset of the data. This introduces noise and variance into the optimization process, making the choice of learning rate and the dynamics of convergence even more fascinating.