Recommended resources
The freely available resources this lesson will direct you to.
Hello. Last time, you identified the bonds that join biological building units, including peptide bonds in proteins. Many enzymes are proteins, and their folded shape is central to what they do: an enzyme must bind a reactant before it can catalyse its reaction.
This lesson examines three conditions that change enzyme activity—temperature, pH, and substrate concentration. You will use a short video, an NCERT passage, and three graphs to explain not only what happens to reaction rate, but why. Allow about 35 minutes, including time to inspect the graphs closely.
What does “enzyme activity” measure?
An enzyme is a biological catalyst: it speeds a reaction without being used up by it. The molecule it acts on is the substrate. A substrate binds at the enzyme’s active site, where the enzyme helps convert it into product; the product leaves, and the enzyme can act again.
In an experiment, activity is commonly assessed by reaction rate—for example, how much product forms per unit time. A faster rate indicates greater activity under the conditions being tested. When interpreting a graph, check which condition changes along the horizontal axis. To attribute a rate change to temperature, for instance, the other relevant conditions should be kept the same.
Watch Factors Affecting Enzyme Activity by The Organic Chemistry Tutor for a first view of the three characteristic curve shapes. Concentrate on the explanation attached to each sketch, rather than trying to memorise its precise outline.
Factors Affecting Enzyme Activity - pH, Temperature, Competitive and Noncompetitive Inhibition
Factors Affecting Enzyme Activity by The Organic Chemistry Tutor sketches how reaction rate changes with temperature, pH, and substrate concentration.
Watch temperature for the rise to an optimum and the subsequent fall, pH for the enzyme-specific optimum, and substrate concentration for the plateau. In the last part, keep your attention on changing substrate concentration while enzyme amount remains fixed.
Now read the corresponding NCERT explanation. It supplies useful exam terms—optimum, denaturation, and saturation—alongside its figure.
Read NCERT’s subsection on factors affecting enzyme activity to connect the graph shapes to the behaviour of enzyme molecules.
In subsection 9.12.4, “Factors Affecting Enzyme Activity” (pp. 157–158), begin with the paragraph starting “The activity of an enzyme can be affected”. Read the explanation through the “Temperature and pH” and “Concentration of Substrate” subheadings. Stop before the paragraph beginning “The activity of an enzyme is also sensitive to the presence of specific chemicals”. Use Figure 9.7 to check which curve has an optimum and which has a maximum-rate plateau.
Temperature: faster reactions, until the enzyme loses its shape
Look at panel (b) below. At relatively low temperatures, enzyme activity is low. As temperature rises, molecules move faster, increasing opportunities for enzyme and substrate to encounter one another and react. Activity rises to a peak: the optimum temperature for that enzyme under those conditions.
Beyond the optimum, the decline has a different cause. Excessive heat can denature the protein, disrupting the three-dimensional shape needed for the active site to function. Substrate may then fail to bind or be converted effectively. The graph therefore does not support the rule “hotter always means faster.”
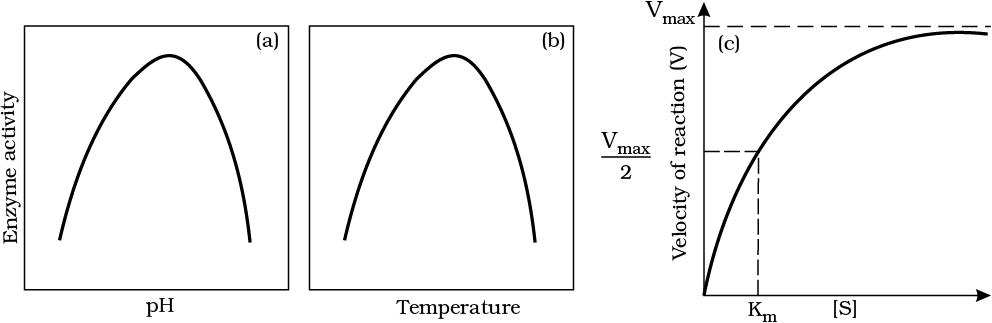
There is an important distinction between the two sides of the temperature peak. Low temperature generally slows activity without destroying the enzyme; NCERT describes this as a temporarily inactive state. At sufficiently high temperature, denaturation can destroy activity. Do not describe cooling and overheating as though they have the same effect on enzyme structure.
The drawing conveys the pattern, not a universal numerical optimum or an exact curve shape. Different enzymes can have different optimum temperatures.
pH: an active site needs a suitable chemical environment
Panel (a) also has a peak, but its horizontal axis is pH, not temperature. Each enzyme has a pH at which its activity is highest: its optimum pH. Moving either toward greater acidity or toward greater alkalinity away from that optimum reduces activity.
Why does pH matter? Changes in pH can change the charges of groups in and around an enzyme’s active site. That can interfere with substrate binding or with the folded structure that positions the active site correctly. At extreme pH, an enzyme may denature. A reduction in activity away from the optimum does not, by itself, prove that denaturation has occurred; altered binding or active-site function can also reduce the rate.
An optimum is enzyme-specific, not a rule that all enzymes work best at neutral pH. For example, the digestive enzyme pepsin functions well in strongly acidic stomach conditions. In a graph question, locate the highest point of that enzyme’s curve before stating its optimum pH.
Substrate concentration: more substrate helps only until enzymes are occupied
Panel (c) is different from the first two. Its horizontal axis, , represents substrate concentration. Here, assume the amount of enzyme and conditions such as temperature and pH stay fixed.
When substrate is scarce, many enzyme active sites are available. Adding substrate allows more enzyme molecules to bind substrate, so the reaction velocity rises. Eventually, enzyme molecules are working close to their full capacity: their active sites are occupied much of the time. The enzyme is said to be saturated. Adding still more substrate produces little or no further increase in rate because there is no additional enzyme capacity available.
The upper limit shown by the dashed line is , the maximum reaction velocity under those conditions. Reaching a plateau does not mean the reaction has stopped. Products are still being formed; the rate has simply stopped increasing appreciably as more substrate is added. Nor does saturation mean that enzyme molecules have been consumed—they continue their catalytic cycles.
You may notice marked on the horizontal axis. In this graph, it is the substrate concentration at which the velocity is half of . You can locate it visually by following the half-maximum level to the curve, then down to the substrate axis. Detailed calculations involving are not needed to explain the rise and plateau here.
These graphs answer different questions. Temperature and pH curves peak and then fall as conditions move beyond the optimum; the substrate curve rises and levels off while enzyme amount is fixed. Do not explain the substrate plateau as heat denaturation, or assume that adding more substrate will repair an enzyme whose active site has been damaged by extreme conditions.
Key takeaways
Enzyme activity depends on the enzyme’s ability to bind substrate and catalyse its conversion to product. Temperature raises activity up to an optimum, but excessive heat can denature the enzyme. pH has an enzyme-specific optimum; moving away from it can disrupt active-site function, and extreme pH may cause denaturation. Increasing substrate concentration raises the rate at first, then approaches as the available enzyme becomes saturated.
In the next lesson, you will build on these explanations to interpret NCERT-style graphs, tables, and experimental observations—including deciding what a graph actually shows before drawing a conclusion.