Recommended resources
The freely available resources this lesson will direct you to.
- GCSE Biology - Enzymes - How Temperature and pH Affect Rate of Reaction (2026/27 exams)www.youtube.com
- Factors Affecting Enzyme Activity - pH, Temperature, Competitive and Noncompetitive Inhibitionwww.youtube.com
- NCERT Exemplar Biomolecules - Biology Class 11 - NEETedurev.in
- 4.3: Enzymes—Biological Catalysts and Regulation - Biology LibreTextsbio.libretexts.org
Hello. In the previous lesson, you explained why temperature, pH, and substrate concentration change enzyme activity. This lesson shifts from explaining the familiar curve shapes to reading evidence carefully: what a composition table compares, what a graph actually establishes, and what an experiment cannot establish without suitable controls.
Allow about 40 minutes. The aim is to make your exam answers both accurate and appropriately cautious—for example, identifying the highest measured rate without claiming you have found an exact optimum.
Reading a cellular-composition table
A percentage is meaningful only when you know its denominator. “Percentage of total cellular mass” refers to the mass of the whole sample, including its water. It is different from “percentage of dry mass,” which excludes water.
Read Q.8 and its accompanying table on EduRev’s NCERT Exemplar Biomolecules page. Notice the wording above the table as well as the values within it.
NCERT Exemplar Biomolecules - Biology Class 11 - NEET
Read Q.8 on EduRev's NCERT Exemplar Biomolecules page to see how a composition table supports an exam conclusion.
Find Q.8, which asks for the most abundant component of living organisms, immediately after Q.7 and before Q.9. Read Q.8 and its table, ending at the ions row. Focus on the column heading, the relative amounts of water and proteins, and the fact that several entries are approximate ranges.
The first defensible conclusion is that water is the most abundant listed component by total cellular mass. Among the listed non-water components, proteins have the largest reported percentage. These are different claims: do not answer “protein” when the question asks for the most abundant component of the whole cell.
The entries are approximate, not a precise recipe for one particular cell. Water is shown as 70–90% and proteins as 10–15%; selecting the upper end of every range would give an impossible total above 100%. The ranges describe variation and approximation, so they should not be combined as though every upper value came from the same specimen.
Consider a hypothetical sample weighing 10 g when collected and 2 g after drying. It contained 8 g of water, so its water percentage by wet mass was:
If that sample contained 1 g of protein, protein would be 10% of wet mass but 50% of dry mass. Both calculations could be correct; they answer different questions. In an exam table, check the heading before comparing percentages or calculating a missing value.
Another distinction matters when interpreting observations about cell contents. Grinding tissue and separating an acid-soluble fraction from an acid-insoluble fraction is not the same procedure as drying it. The soluble fraction contains many small molecules, such as free amino acids and sugars; the insoluble fraction contains major macromolecules such as proteins and nucleic acids, as well as membrane-associated material. Do not treat “acid-soluble” as a synonym for “water,” or assume every substance in the insoluble fraction must be a polymer.
Reading an enzyme graph without adding information
A graph gives you a relationship between the quantities on its axes. Before explaining it, identify the condition on the horizontal axis, the measure of activity on the vertical axis, and whether numerical scales are supplied.

The dotted line in pH Value identifies where the plotted enzyme works fastest. Because the horizontal axis has no numbers, you cannot report its optimum as pH 7—or any other value. You can say that activity decreases as pH moves away from the indicated optimum. Changes in the charge of groups involved in binding and catalysis can account for reduced activity; severe pH conditions may also denature an enzyme. A lower point on this curve alone does not prove denaturation.
A substrate-concentration graph requires a different interpretation:
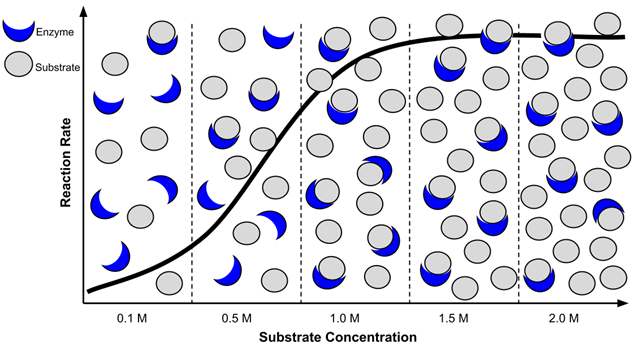
In Enzymes and substrate concentration, the vertical quantity is rate, not total product accumulated. The nearly flat right-hand region means that adding more substrate produces little further increase in rate under the illustrated conditions. It does not mean the enzyme has stopped making product. The drawings of enzymes and substrates help explain the trend; they are not counts from which to calculate an exact rate.
Compare the two images as evidence rather than merely as shapes. The pH graph has a peak followed by a decline when conditions move away from the optimum. The substrate graph rises toward a plateau as substrate increases. A plateau with fixed enzyme amount is consistent with enzyme saturation; a falling pH curve calls for an explanation involving changed enzyme function. Neither image, on its own, tells you what happened in every possible enzyme experiment.
For an example of how to turn a pH curve into a short written explanation, read the first short-answer question on the same EduRev page.
NCERT Exemplar Biomolecules - Biology Class 11 - NEET
Read the pH-curve question and its answer to see how an exam response connects the graph's trend with enzyme structure.
Under “SHORT ANSWER TYPE QUESTIONS,” find Q.1, which begins by describing amino acids and ionisable functional groups. Read Q.1 and its answer, stopping before Q.2 on rubber. Notice how the answer distinguishes reduced activity away from the optimum from possible denaturation at extreme pH.
From experimental observations to a justified conclusion
Real questions often give a table of product formed, not a ready-made rate graph. Suppose equal amounts of one enzyme were tested with the same substrate for four minutes. The product measurements below have already been corrected for any product detected in a matching test without enzyme.
| Tube | Temperature | pH | Substrate concentration | Product in first 4 min |
|---|---|---|---|---|
| A | 30 °C | 7 | 1% | 24 µmol |
| B | 45 °C | 7 | 1% | 40 µmol |
| C | 65 °C | 7 | 1% | 4 µmol |
| D | 45 °C | 4 | 1% | 12 µmol |
| E | 45 °C | 7 | 2% | 40 µmol |
Because every measurement spans the same four minutes, the average rates can be compared directly. Tube B’s average rate is µmol per minute; tube A’s is µmol per minute. Stating the rate and its unit is clearer than calling 40 µmol “the activity.”
Now choose comparisons in which one condition changes. A, B, and C hold pH and substrate concentration fixed: rate is highest at 45 °C among the temperatures tested. That wording matters. The table does not rule out a higher rate at an untested temperature nearby, and C’s low rate does not by itself prove permanent heat damage. B and D differ in pH, so they show that the measured rate was lower at pH 4 than at pH 7 under these conditions; they do not identify an exact optimum pH.
B and E differ in substrate concentration, yet have the same measured average rate. This is consistent with the enzyme approaching a substrate-saturation plateau. Two matching measurements are not enough to locate a precise plateau or prove that no further increase is possible. More concentrations and repeat measurements would make that conclusion stronger.
The table also illustrates why experimental details matter. Measuring product at several early time points would let you estimate the slope of a product-versus-time graph—an initial rate—rather than relying only on a four-minute average. A suitable test without enzyme checks for product that appears without enzyme action. To test whether heat caused lasting loss of activity, you could compare an enzyme sample that was heated and then cooled with an unheated sample, assaying both under the same final conditions. If the preheated sample remained less active, that would support lasting heat-related damage more directly than tube C alone.
Making your interpretation exam-ready
For a graph, table, or experimental observation, a compact answer can usually follow three moves:
- State the comparison: name the axes or variables, and give measured values and units when supplied.
- Describe the supported trend: identify a rise, fall, peak, plateau, or difference between controlled treatments.
- Explain without overclaiming: connect the trend to cellular composition or enzyme behaviour, while distinguishing observations from possible mechanisms.
For example, “The reaction rate was highest at 45 °C among the temperatures tested” reports an observation. “Activity may fall at higher temperatures because heat disrupts the enzyme’s functional shape” supplies an explanation. Calling 45 °C the enzyme’s exact optimum, or asserting that tube C proves irreversible denaturation, goes beyond those data.
Key takeaways
Always establish what is being measured and what is held constant before interpreting a biological table or graph. Cellular percentages depend on whether the basis is wet or dry mass; approximate ranges are not an exact inventory of one cell. On enzyme graphs, distinguish a pH optimum from a substrate-concentration plateau. In experiments, calculate rates when needed, compare treatments that differ in one variable, and separate a measured result from an inferred mechanism.
This completes the cell-and-biomolecule module. Next, you will move from cell contents and activity to the cell cycle, beginning with the order and key events of its phases.