Recommended resources
The freely available resources this lesson will direct you to.
- Utility & Marginal Utilitywww.youtube.com
- Introduction to utility | APⓇ Microeconomics | Khan Academywww.youtube.com
- Marginal Utility versus Total Utility | Microeconomics - Lumen Learningcourses.lumenlearning.com
- Utility – Intermediate Microeconomics - Oregon State Universityopen.oregonstate.education
Hello! Welcome to the first lesson in our new module, Consumer Choice and Utility Theory.
Introduction
In our last module, we developed a powerful model of supply and demand to understand how markets function. We saw how the interaction of buyers and sellers determines prices and quantities, and how government policies can affect those outcomes. Now, we're going to take a step back and look "under the hood" of the demand curve. Why does it slope downwards? What thought process do consumers go through when deciding what to buy?
This lesson begins our journey into the theory of consumer behavior. It directly addresses the learning outcome: Define total utility and marginal utility, and apply the law of diminishing marginal utility.
We will explore:
- The concept of utility as a measure of satisfaction.
- The distinction between total utility (the overall satisfaction from consumption) and marginal utility (the satisfaction from one additional unit).
- The fundamental law of diminishing marginal utility, a key principle that helps explain a wide range of economic behaviors.
Understanding these concepts is the first step toward building a formal model of how a rational consumer makes choices, which will ultimately show us exactly where the demand curve comes from.
1. Utility: A Measure of Satisfaction
Economists needed a way to model the goal of a consumer. If firms aim to maximize profit, what do individuals aim to maximize? They settled on the concept of utility, which is a measure of the satisfaction, happiness, or well-being a person gets from consuming a good or service.
To make this concept workable, they imagined a unit of measurement called the "util." As you will see, the absolute value of utils is less important than how they help us rank our choices.
Let's start with a video that introduces the concepts of utility, total utility, and how economists use them to think about consumer happiness.
This video from the 'Principles of Microeconomics' channel clearly defines utility and introduces the idea of total utility using a simple example with pizza slices.
Watch the video from 00:30 to 03:19. Focus on the definitions of utility and total utility. Notice how total utility is the cumulative satisfaction from all units consumed.
As the video explains, total utility is the total amount of satisfaction you get from consuming a specific quantity of a good. Consuming three slices of pizza gives you a certain total utility; consuming four slices gives you a new, higher total utility.
Ordinal vs. Cardinal Utility
A crucial point that modern economists emphasize is that utility is an ordinal, not a cardinal, concept. This might sound technical, but the idea is simple and aligns with your analytical background.
- Cardinal measurement would mean we can say how much more satisfaction one option gives than another (e.g., "Bundle A gives me 20 utils, which is exactly twice as much satisfaction as Bundle B's 10 utils"). This is a very strong and generally unrealistic assumption.
- Ordinal measurement simply means we can rank our options (e.g., "I prefer Bundle A to Bundle B," which we can represent by assigning A a higher utility number than B, like 20 vs. 10, or 5 vs. 4). The numbers only show the order of preference, not the magnitude of the difference.
For a more detailed explanation of this important distinction, the following reading is very helpful.
Utility – Intermediate Microeconomics
This text from an Intermediate Microeconomics OER at Oregon State University explains the modern understanding of utility functions as ordinal.
Read the section titled '2.1 Utility Functions'. Pay attention to the distinction between ordinal and cardinal utility and the example of runners in a race.
2. Marginal Utility and Diminishing Returns
While total utility tells us about overall satisfaction, economists are often most interested in decisions made "at the margin." As we saw in a previous module, this means thinking about the impact of the next unit. This brings us to the idea of marginal utility.
Marginal Utility (MU) is the additional utility a consumer gets from consuming one more unit of a good.
It is calculated as the change in total utility divided by the change in quantity:
Let's return to the video to see how marginal utility is calculated and to introduce the most important rule governing it.
This part of the video defines marginal utility and demonstrates how to calculate it from the total utility table. It then introduces the cornerstone concept of this lesson: diminishing marginal utility.
Watch from 03:47 to 07:44. Focus on how each additional slice of pizza adds less to the total utility than the one before it. This is the law of diminishing marginal utility.
As the video highlights, we observe a very common pattern: the first slice of pizza gives a huge boost in satisfaction, the second slice is still good but adds a bit less, and the third adds even less. This is the Law of Diminishing Marginal Utility, which states that as consumption of a good increases, the marginal utility derived from each additional unit declines.
It is critical to distinguish between total and marginal utility here:
- As long as marginal utility is positive, total utility will increase.
- Diminishing marginal utility just means that total utility is increasing at a slower rate.
- If you eat so much that an extra slice actually makes you feel worse, the marginal utility for that slice would be negative, and your total utility would decrease.
3. The Relationship Between Total and Marginal Utility
The relationship between total and marginal utility is best understood graphically. The marginal utility is the slope of the total utility function.
- When the marginal utility is positive and diminishing, the total utility curve rises but becomes flatter.
- When total utility reaches its maximum point, the marginal utility of the next unit is zero. You are fully satiated.
- When marginal utility becomes negative, the total utility curve starts to slope downwards.
The following image provides a clear, generalized illustration of this relationship.
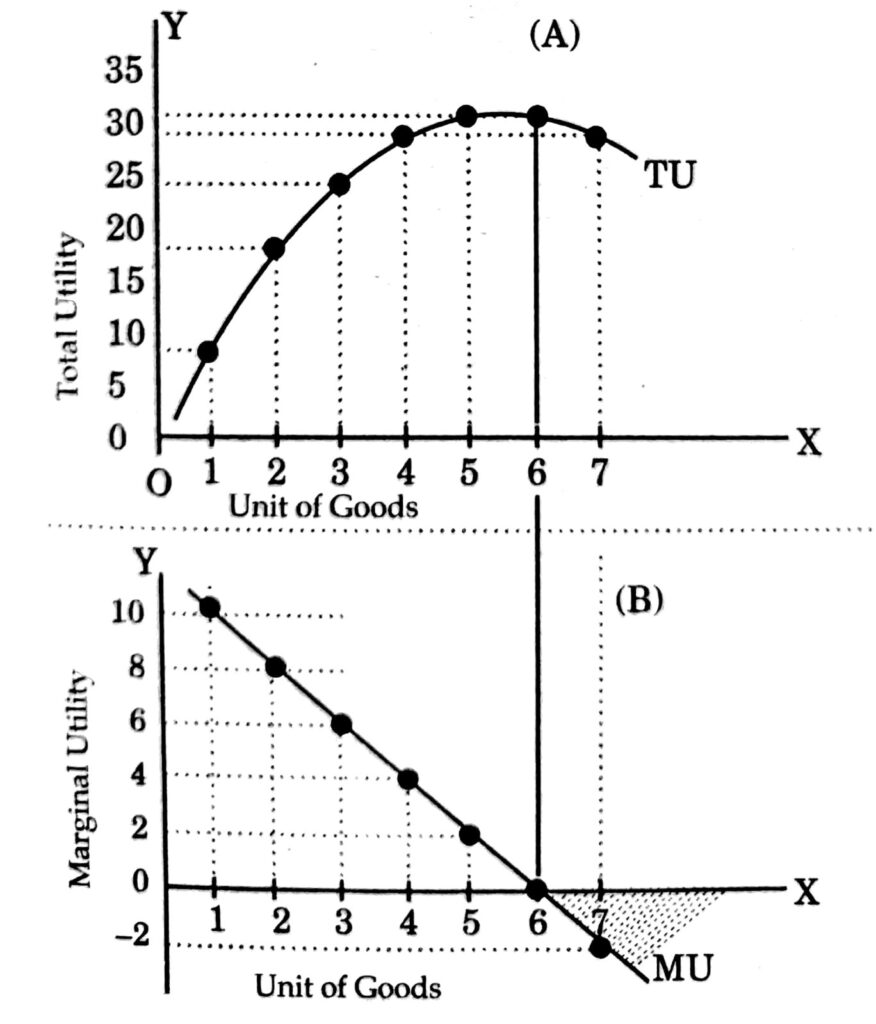
To see these curves built from a concrete example, the final segment of the video walks through the process of graphing the pizza data.
This final clip connects all the concepts by graphing the total utility and marginal utility curves from the pizza example. Notice how the shape of the total utility curve reflects the value of the marginal utility.
Watch from 07:44 to the end. Observe how the slope of the total utility curve at each point corresponds to the height of the marginal utility curve.
Practice Problem
Let's put your understanding to the test. The table below shows a student's total utility from consuming cups of coffee while studying.
- Calculate the marginal utility for each additional cup.
- Does the student experience diminishing marginal utility? How can you tell?
- After which cup does total utility begin to decrease? What is the marginal utility of that cup?
| Cups of Coffee | Total Utility (in utils) | Marginal Utility |
|---|---|---|
| 0 | 0 | - |
| 1 | 15 | ? |
| 2 | 28 | ? |
| 3 | 38 | ? |
| 4 | 44 | ? |
| 5 | 46 | ? |
| 6 | 46 | ? |
| 7 | 43 | ? |
Click to see the solution
| Cups of Coffee | Total Utility (in utils) | Marginal Utility |
|---|---|---|
| 0 | 0 | - |
| 1 | 15 | 15 |
| 2 | 28 | 13 |
| 3 | 38 | 10 |
| 4 | 44 | 6 |
| 5 | 46 | 2 |
| 6 | 46 | 0 |
| 7 | 43 | -3 |
- The marginal utility column is filled in above. For example, the MU of the 2nd cup is .
- Yes, the student experiences diminishing marginal utility because the numbers in the marginal utility column are continuously decreasing after the first cup.
- Total utility begins to decrease after the 6th cup. The 7th cup causes total utility to fall from 46 to 43. The marginal utility of the 7th cup is -3 utils.
Conclusion
In this lesson, we established the foundational concepts of consumer theory. You learned how economists model satisfaction and how the satisfaction from additional consumption tends to fall.
Here are the key takeaways:
- Total Utility (TU) is the overall satisfaction from consuming a certain quantity of a good.
- Marginal Utility (MU) is the additional satisfaction from consuming one more unit.
- The Law of Diminishing Marginal Utility states that as you consume more of a good, the MU from each additional unit tends to decline.
- Total utility increases as long as marginal utility is positive. Total utility is maximized when marginal utility is zero.
These ideas are the building blocks for understanding consumer choice. However, our desires are unlimited, but our resources are not. In the next lesson, we will introduce the other side of the consumer's problem: the budget constraint. By combining what a consumer wants (utility) with what they can afford (their budget), we will be able to determine their optimal consumption choice.