Recommended resources
The freely available resources this lesson will direct you to.
Hello. In the previous lesson, you assessed whether a cloud topology could support its claims about resilience, security, recovery, and operation. That review focused on the design of a service. This lesson shifts to the health of the delivery system: can the organization release changes, keep customer commitments, recover when something breaks, and improve without accumulating hidden fragility?
For a Director, delivery health is not a dashboard of engineering activity. It is evidence for decisions: whether to release, slow down, invest in reliability, accept a known risk, or redirect capacity from roadmap work to foundational improvement. By the end of this lesson, you should be able to diagnose delivery health using service objectives, delivery metrics, release-risk evidence, incidents, and technical debt—and turn that diagnosis into an explicit leadership action.
Delivery health is the ability to make and keep promises
A team can appear productive while becoming operationally weaker. It may close many tickets, complete planned features, and still suffer from long release cycles, fragile deployments, recurring incidents, overloaded on-call engineers, and emergency work that displaces the roadmap.
Conversely, a team that releases frequently is not necessarily healthy if those releases repeatedly harm customers.
A useful Director-level definition is:
Engineering delivery health is the organization’s ability to deliver valuable changes at a sustainable pace while meeting the customer commitments it has made for reliability, performance, safety, and support.
This definition has two connected dimensions:
| Dimension | Core question | Typical evidence |
|---|---|---|
| Customer and service health | Are customers receiving the promised service? | Service-level objectives, error-budget use, incident impact, support escalations |
| Delivery-system health | Can the organization change the service safely and repeatedly? | Lead time, deployment frequency, change failure rate, restore time, release readiness, technical debt |
Your release-readiness and QA experience provides a strong starting point here: you already evaluate whether a release has sufficient functional validation, known-defect understanding, customer-impact assessment, and cross-team readiness. The Director-level extension is to ask whether the system producing releases is becoming safer and faster over time—or merely relying on increasingly expensive human coordination.
A healthy organization does not eliminate risk. It makes risk visible, chooses it deliberately, and learns from its outcomes.
Start with the customer promise: SLIs, SLOs, and error budgets
Before diagnosing delivery speed, establish what the organization is trying to protect. A release cannot be called successful merely because deployment tooling completed. It must preserve the service outcome that matters to users.
Three terms provide the foundation:
- Service-level indicator (SLI): a measurement of an outcome experienced by users.
- Service-level objective (SLO): the target level for that outcome over a defined period.
- Error budget: the amount of unreliability that remains acceptable within that period.
A common SLI is a ratio:
For example, an infrastructure control service could define “good” as a configuration request that completes correctly within a stated time. A fleet-management product might define “good” as a machine upgrade that completes without violating a protected-service availability threshold.
An SLO could then be:
Over a rolling 28-day period, 99.9% of eligible control requests complete successfully within five minutes.
If the service receives eligible requests and has an SLO of , its error budget is:
With two million eligible requests in a period and an SLO of 99.9%, the budget is 2,000 bad events. That number is not an allowance to be careless. It is a decision tool: it tells leaders how much reliability risk remains before feature velocity should be constrained.
Read the relevant sections of Google’s SRE Workbook to see how service objectives convert reliability from a general aspiration into an explicit trade-off between customer outcomes, engineering capacity, and release decisions.
Begin with “Why SREs Need SLOs.” Read the opening rationale to focus on why SLOs are a prioritization mechanism rather than an operations-only concern. Then read “What to Measure: Using SLIs,” especially the SLI explanation. Notice the distinction between the user outcome you want to measure and the implementation used to measure it. In “Establishing an Error Budget Policy,” read the policy rationale. Finally, in “Decision Making Using SLOs and Error Budgets,” study the comparative example. Focus on the leadership lesson: fund the reliability problem consuming the most customer impact, not simply the most visible incident.
Choose objectives that reflect the service type
Not every service should be measured only by uptime. The relevant customer promise depends on how the service is used.
| Service type | Useful customer-oriented SLI examples |
|---|---|
| Request-driven API or user interface | Successful requests, latency, correctness, degraded-response rate |
| Asynchronous pipeline | Freshness of results, processing coverage, successful completion, backlog age |
| Storage or database service | Durability, read success, data correctness, restore success |
| Infrastructure upgrade workflow | Upgrade completion, time to safe completion, rollback success, post-upgrade health |
| Internal engineering platform | Developer workflow success, build duration, deployment success, environment availability |
For an enterprise infrastructure product, the most important SLOs may concern upgrade safety, management-plane availability, data protection, or resolution time for severe service impairment. A generic “99.99% uptime” target may be less useful than an objective tied to the actual customer workflow.
The critical leadership question is:
If this metric deteriorates, would a customer notice in a meaningful way?
If not, it may still be a useful internal operational metric, but it should not be mistaken for a customer commitment.
Use delivery metrics as evidence, not scorecards
The widely used DORA framework organizes four delivery metrics into two complementary categories:
| Dimension | Metric | What it measures |
|---|---|---|
| Throughput | Deployment frequency | How often the organization successfully releases to production |
| Throughput | Lead time for changes | How long a committed change takes to reach production |
| Stability | Change failure rate | The proportion of deployments that cause a production failure or require remediation |
| Stability | Time to restore service | How long it takes to recover service after a production failure |
The point is not to demand daily releases from every team. A database appliance, infrastructure platform, regulated system, and consumer web application naturally have different release units and cadences. The point is to understand the relationship between speed, batch size, reliability, and recovery.
Use Four Keys metrics like change failure rate to ... - Google Cloud
Read Google Cloud’s overview of the Four Keys metrics to establish precise definitions before interpreting a delivery dashboard. The details matter: inconsistent definitions can make metrics look better while customer risk is unchanged.
In the opening section, read the four-metric overview and note the separation between velocity and stability. Then read the section beginning “Calculating the metrics.” In the “Deployment frequency” subsection, study the deployment definition. Continue through the “Lead Time for Changes,” “Change Failure Rate,” and “Time to Restore Services” subsections. Pay particular attention to the incident linkage: a change-failure metric requires a credible connection between deployments and production incidents.
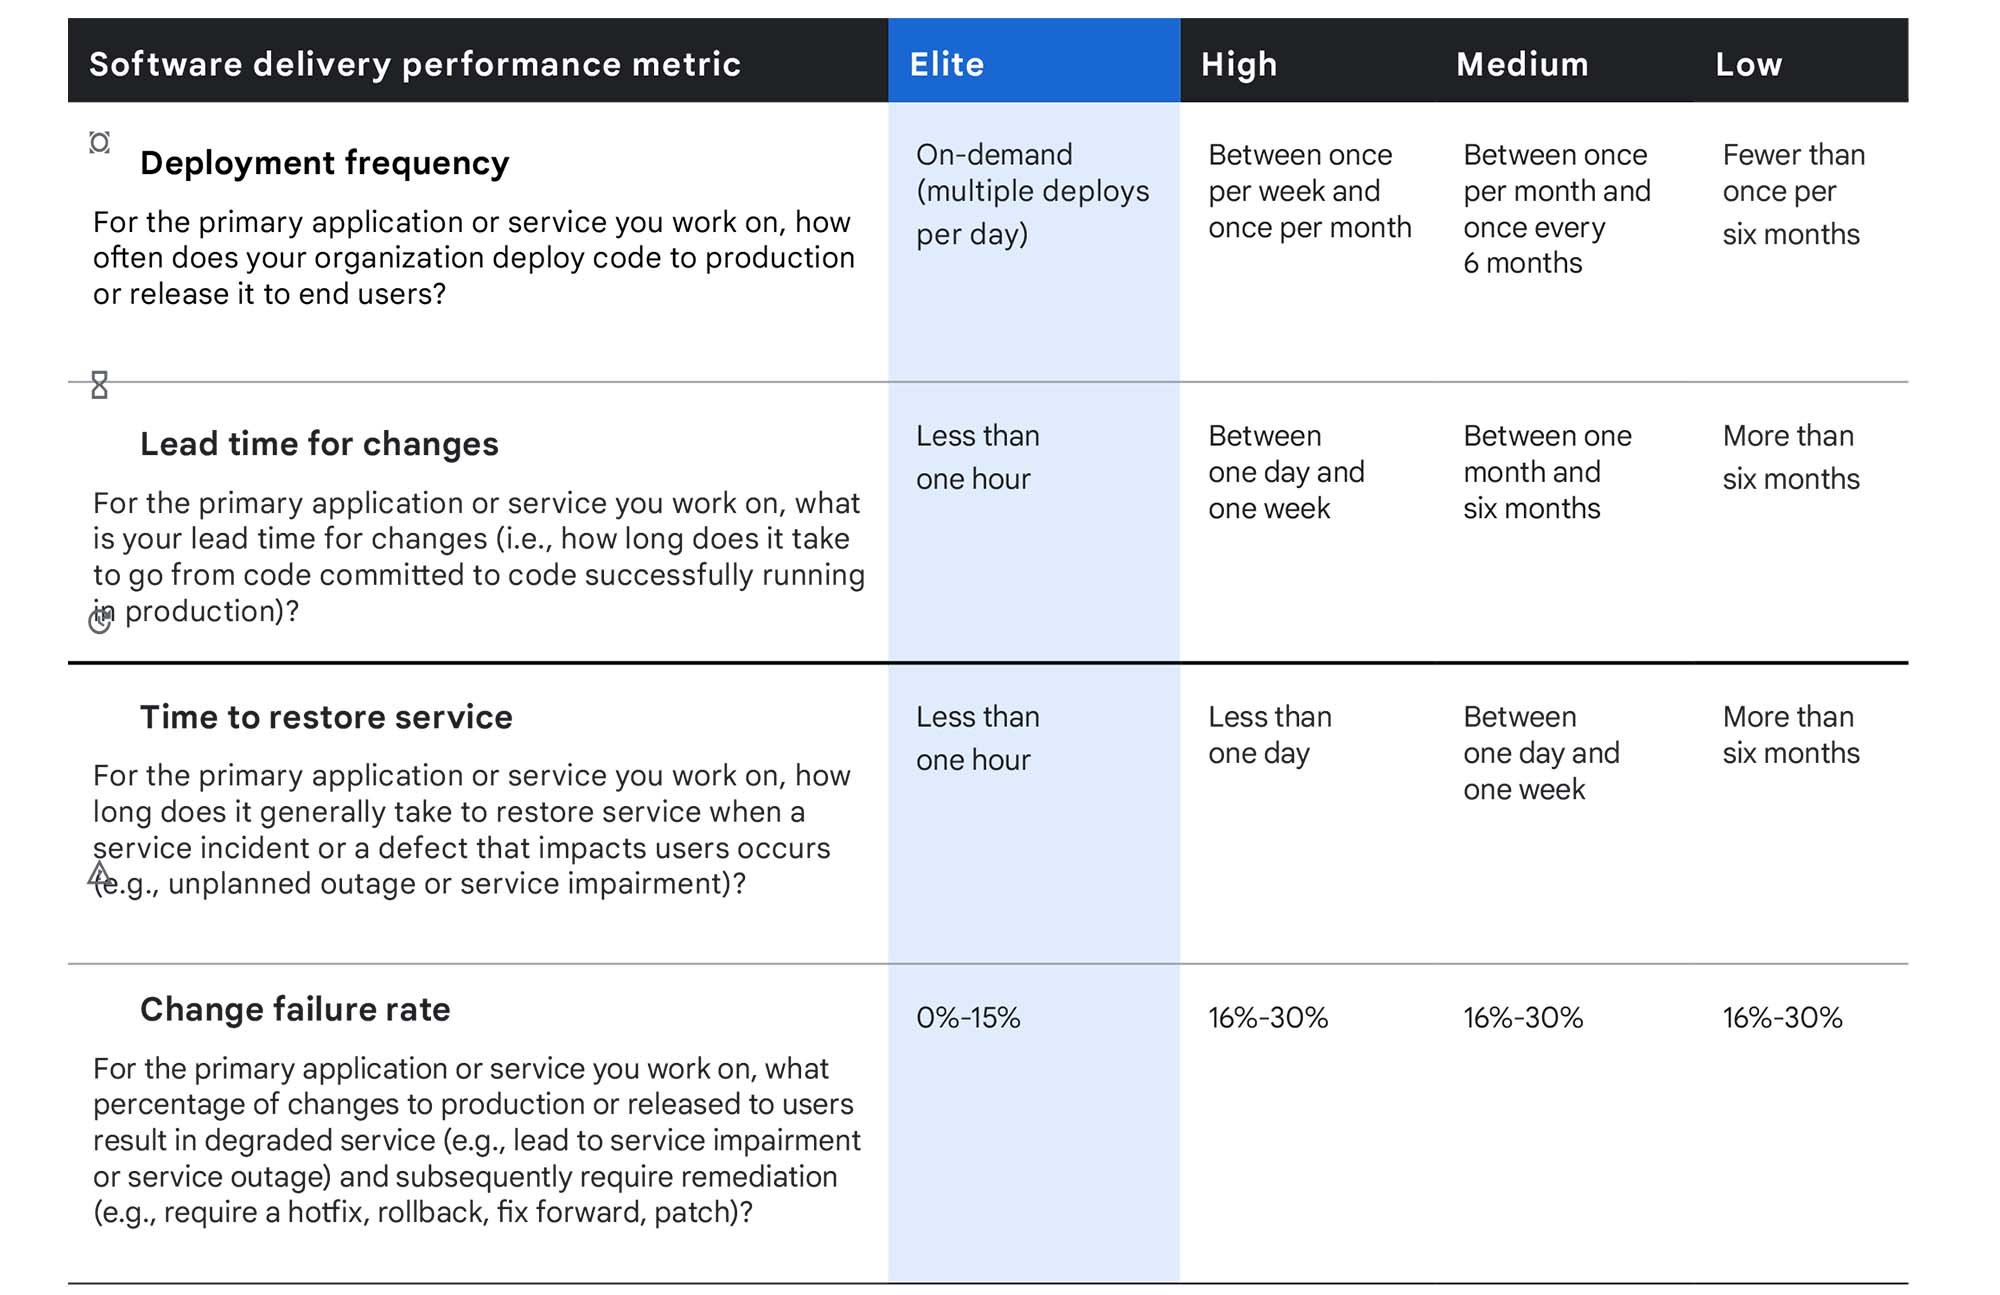
The image provides a useful reference, but it should not become a management target board. A team can game every one of these metrics:
- Splitting one meaningful deployment into many trivial deployments can inflate deployment frequency.
- Closing incidents prematurely can make restoration time appear shorter.
- Excluding inconvenient incidents can artificially lower change failure rate.
- Measuring lead time only from a late-stage branch can hide weeks of waiting, review, rework, or dependency delay.
A credible delivery-health review therefore uses stable definitions, consistent scope, and trends over time. It also combines metrics with incident and customer evidence.
Measuring Software Delivery With DORA Metrics
Watch “Measuring Software Delivery With DORA Metrics” by Modern Software Engineering for a concise explanation of why throughput and stability need to be interpreted together—and how metrics can be misused when treated as targets.
Start with the four measures for the relationship between the stability and throughput metrics. Then continue with the misuse warnings. Focus on the argument that delivery speed without quality creates rework and reduces sustainable capacity; the purpose of measurement is improvement, not internal competition.
Read the patterns, not just the numbers
The following patterns are more informative than any isolated metric.
| Pattern | Likely interpretation | Director-level follow-up |
|---|---|---|
| High deployment frequency and low change failure rate | Small, well-controlled changes may be working. | Check whether customer SLOs and support signals agree. Avoid creating unnecessary approval gates. |
| Low deployment frequency and long lead time | Large batches, excessive handoffs, environment bottlenecks, or difficult integration may be present. | Map where work waits and where rework enters the flow. |
| Faster delivery with rising change failure rate | The organization may be trading reliability for short-term output. | Tighten release controls for risky changes; investigate batch size, test gaps, rollback readiness, and on-call burden. |
| Low change failure rate but very slow delivery | The team may be over-controlling releases or deploying too rarely to learn safely. | Assess whether manual governance, release windows, or fear of rollback is creating an avoidable bottleneck. |
| Repeatedly long restore times | Detection, diagnosis, ownership, rollback, runbooks, or system observability may be weak. | Review the incident timeline, not merely the final root-cause label. |
| Good DORA metrics but poor customer satisfaction | The wrong workflow may be measured, or important degradation is not visible in the chosen SLI. | Revisit the SLO and customer journey; add outcome measures such as freshness, correctness, or support escalation rate. |
The essential principle is that throughput and stability must improve together over time. A rapid release process that generates outages is not high performance. A highly controlled process that cannot deliver needed changes is not reliability; it may be stagnation disguised as caution.
Add release risk: “ready” must mean more than “tested”
Delivery metrics are largely historical. They tell you what has happened. Release risk helps answer what could happen next.
A release-risk assessment should not be a ceremonial checklist. It should force a practical conversation about the specific change, its blast radius, its reversibility, and the evidence supporting a release decision.
For each material release, review these dimensions:
| Risk lens | Questions a Director should ask |
|---|---|
| Customer impact | Which customers, workloads, geographies, or contractual commitments are affected if this goes wrong? |
| Change scope | Is this a small isolated change, a cross-service integration, a state migration, or a platform-wide dependency update? |
| Reversibility | Can the team roll back safely? If data or schema changes occur, is rollback technically meaningful? |
| Validation evidence | What has been tested in representative conditions, and what remains untested? |
| Operational readiness | Are dashboards, alerts, ownership, escalation paths, and runbooks ready before exposure increases? |
| Dependency readiness | Are dependent services, external vendors, capacity limits, certificates, and security approvals in a known state? |
| Error-budget position | Does the service have enough reliability headroom to absorb the risk of this release? |
| Recovery path | If customer harm begins, who decides, who executes rollback or mitigation, and how quickly can the team verify recovery? |
This is especially important for infrastructure and database-adjacent changes. A code rollback can be quick; a data migration, firmware update, configuration schema change, or distributed compatibility issue may not be. The release decision must reflect that asymmetry.
A useful distinction is:
- Low risk does not mean “no defects are possible.”
- High risk does not mean “do not release.”
- Unowned risk means the release is not ready.
A high-risk release may be appropriate when customer value is material and mitigation is credible. In that case, the leadership decision should state the customer impact, safeguards, decision owner, rollback condition, and communication plan.
Treat incidents as operational evidence
Incident counts by themselves are weak evidence. Ten small, quickly resolved issues may matter less than one incident that exhausts most of a service’s error budget, damages customer trust, or exposes a dangerous recovery gap.
A Director should look at every significant incident through five questions:
-
What was the customer impact?
Identify affected workflows, duration, customers, regions, data integrity, and contractual or reputational implications. -
What failed in the system?
Separate the initiating event from the conditions that allowed impact to spread. A bad configuration may trigger an outage, but missing validation, weak isolation, poor alerting, or a difficult rollback path often determine its severity. -
How was the incident detected?
Did user reports, a major customer escalation, or monitoring reveal the issue? Customer detection is a warning that observability does not reflect the real experience. -
How was service restored?
Determine whether recovery depended on documented automation, expert heroics, manual intervention, a risky workaround, or a fortunate rollback. -
What changed afterward?
A post-incident review is complete only when the organization has made and tracked decisions that reduce recurrence or reduce impact.
A blameless postmortem does not mean absent accountability. It means the organization examines system conditions and decision processes rather than simplifying the explanation to an individual mistake. Accountability remains clear: each corrective action needs an owner, a due date, evidence of completion, and a reason it is prioritized over other work.
Link incidents back to changes and service objectives
The strongest incident analysis connects four things:
| Evidence | What it tells you |
|---|---|
| Incident timeline | How detection, escalation, mitigation, and recovery actually unfolded |
| Deployment history | Whether a change caused or materially contributed to the incident |
| SLO and error-budget impact | How much of the customer commitment was consumed |
| Repeat pattern | Whether the incident is isolated, systemic, or an expression of known debt |
This prevents a common failure mode: the organization closes the immediate bug but learns nothing about why the release system, monitoring, architecture, or ownership model allowed the failure to become customer harm.
Make technical debt a business case, not an inventory
Technical debt is often reported as an undifferentiated backlog of “cleanup work.” That framing is difficult for product and executive stakeholders to prioritize because it does not show the cost of delay or the customer consequence.
Instead, connect each meaningful debt item to observable delivery or service friction.
| Debt category | Typical symptom | Relevant health signal | Better investment framing |
|---|---|---|---|
| Reliability debt | Repeated outages, weak failover, fragile dependencies | Error-budget burn, incident recurrence, restore time | Reduce probability or blast radius of customer harm |
| Delivery debt | Long integration, large release batches, difficult rollback | Lead time, change failure rate, release delays | Reduce time and risk required to deliver future changes |
| Operational debt | Manual recovery, recurring triage, expert dependency | On-call toil, restoration time, escalation frequency | Reduce operational load and single-person dependency |
| Quality debt | Regression escapes, low confidence in changes | Customer defects, incident links to releases, validation gaps | Improve release confidence and lower rework |
| Architecture debt | Coupled services, obsolete components, unclear ownership | Dependency-driven incidents, slow diagnosis, blocked roadmap | Preserve strategic option value and delivery capacity |
The key is a causal statement:
Because the integration environment is unstable, teams wait days for valid test results; changes accumulate into larger batches; rollback becomes harder; and change failure risk rises.
That statement is much more decision-useful than: “We have integration-test debt.”
For each major investment candidate, ask for five pieces of evidence:
- The observed delivery or customer problem.
- The mechanism connecting the debt to that problem.
- The scope of the proposed investment.
- The expected measurable improvement.
- The cost of not investing, including roadmap delay or continued operational burden.
Do not promise false precision. A debt-reduction initiative may not guarantee that lead time falls by exactly 30%. But it should specify what evidence would demonstrate that the investment is working.
A practical delivery-health diagnostic
Use the following sequence in a monthly or quarterly operating review. It is designed to produce a decision, not a dashboard recital.
1. Establish the scope
Specify:
- the service or product area;
- the customer workflows included;
- the review period;
- the release unit being measured;
- the teams and dependencies in scope.
For a large infrastructure organization, do not combine unrelated components into one average. A healthy management-plane team can conceal a struggling upgrade workflow, and a stable core database can conceal a brittle customer provisioning pipeline.
2. Assess service health first
Review:
- the SLO target and actual performance;
- error-budget consumption and burn rate;
- customer-impacting incidents;
- support trends and escalations;
- known periods of degraded service.
Ask whether the service is meeting the promise that matters to its users.
3. Review throughput and stability together
Use deployment frequency and lead time alongside change failure rate and restoration time. Compare trends over several periods rather than reacting to one unusual week.
Segment the data where useful:
- standard versus high-risk changes;
- customer-facing versus internal changes;
- routine releases versus emergency fixes;
- service area, team, or release train.
Segmentation should clarify system behavior, not create a ranking system for individuals.
4. Identify current release risk
For upcoming material releases, inspect change scope, test evidence, rollback feasibility, dependency conditions, operational readiness, and remaining error-budget headroom.
If risk is high, the response may be a phased rollout, narrower customer exposure, added monitoring, a rollback rehearsal, an explicit exception approved at the right level, or a decision to delay.
5. Use incident evidence to find the weak link
Look for patterns:
- Are incidents disproportionately caused by releases?
- Is detection coming from customers rather than monitoring?
- Are recovery times long because rollback is difficult?
- Are the same dependencies or ownership boundaries recurring?
- Does the organization repeatedly choose temporary mitigations because structural work never receives capacity?
6. Select a limited set of actions
A diagnosis is incomplete without a decision. Select the few actions most likely to improve the health constraint that matters now.
Possible actions include:
- pause nonessential releases while error budget is exhausted;
- fund an automated rollback or safer deployment mechanism;
- reduce a known dependency’s blast radius;
- fix an observability gap that delays detection;
- remove a manual operational step that repeatedly delays recovery;
- change the release process for data migrations;
- revise an SLO only when evidence shows it does not represent a meaningful customer expectation.
Worked example: an enterprise infrastructure release organization
Consider a fictional infrastructure management service with these 28-day results:
| Evidence | Observation |
|---|---|
| Customer SLO | 99.9% of critical management operations should complete successfully within five minutes |
| Error-budget use | 72% consumed, largely in two release-related incidents |
| Deployment frequency | Two major releases and six smaller configuration deployments |
| Lead time | Median of 38 days from approved change to customer production exposure |
| Change failure rate | Two of eight deployments required production mitigation |
| Time to restore service | Median of seven hours for the two significant incidents |
| Incident detection | One incident was first detected through a strategic customer escalation |
| Technical-debt evidence | Rollback requires manual coordination across three teams; integration validation depends on a constrained shared environment |
A weak diagnosis would be:
Quality needs improvement. Add more testing before release.
A stronger diagnosis is:
The organization’s principal constraint is not general test volume. Release-related incidents consume most of the error budget, customers detect issues before monitoring does, and manual multi-team rollback extends recovery time. Long lead time and a constrained integration environment cause changes to accumulate, increasing release batch size and raising change risk. The immediate priority is to improve rollback and customer-journey monitoring; the next investment should reduce shared-environment dependency and enable smaller validated changes.
That diagnosis leads to decisions such as:
| Decision | Rationale | Evidence of progress |
|---|---|---|
| Require a tested rollback plan for material releases | Manual rollback is extending customer impact | Restore time for release-related incidents; rollback rehearsal results |
| Add monitoring for critical customer workflows | Customers are detecting issues first | Proportion of incidents detected internally; alert quality |
| Restrict high-risk releases until service returns within SLO | Error budget is nearly consumed | Error-budget trend and post-release SLO impact |
| Fund integration-environment automation or isolation | Waiting and batch accumulation are inflating delivery risk | Lead time, batch size, environment wait time |
| Assign an accountable cross-team owner for release recovery | Multi-team coordination is a recurring recovery bottleneck | Recovery drill outcomes and ownership clarity |
Notice what this approach does not do: it does not blame the QA function, demand more release meetings, or declare that every release must become daily. It identifies the constraint, protects customers, and funds the capability that will improve both delivery speed and operational confidence.
A concise Director-level health readout
A useful executive update can fit on one page. Its structure should be consistent:
-
Overall health statement
“Customer service is within SLO, but release-related reliability risk is elevated because restoration remains manual and error-budget consumption is concentrated in high-impact changes.” -
Evidence
Include the most decision-relevant SLO, error-budget, delivery, incident, and debt indicators. -
Interpretation
Explain the connection between the evidence. Avoid listing metrics without a conclusion. -
Decision required
State what leadership needs to approve, defer, accept, or escalate. -
Actions and owners
Include accountable owner, date, and success measure for each significant action. -
Risks being accepted
Make explicit what will happen if the organization chooses not to invest or slow down.
This style is particularly valuable in external Director, Senior Manager, and Principal TPM interviews. It demonstrates that you can translate engineering evidence into business choices without oversimplifying the technical reality.
Key takeaways
Delivery health is the organization’s capacity to deliver valuable change while reliably meeting customer commitments.
- Begin with customer outcomes: define SLIs, SLOs, and an error-budget policy before judging release velocity.
- Use deployment frequency and lead time together with change failure rate and time to restore service. Speed without stability is not sustainable performance.
- Interpret metrics as evidence of system behavior, not as targets for teams or individuals.
- Evaluate release risk explicitly through blast radius, reversibility, validation, dependency readiness, operational readiness, and remaining error-budget capacity.
- Treat incidents as evidence about detection, recovery, ownership, architecture, and decision-making—not just defects to close.
- Translate technical debt into a business case by connecting it to customer impact, delivery delay, operational toil, or strategic constraint.
- End every health review with an owned decision: accelerate, constrain releases, invest, accept a defined risk, or revise an invalid assumption.
In the next lesson, you will apply this operational perspective to an organizational leadership case: diagnosing whether team structure, accountability, delegation, talent, succession, and conflict patterns are helping or obstructing reliable delivery.