Recommended resources
The freely available resources this lesson will direct you to.
Welcome back. In the previous lesson, you reviewed high-level architectures through six lenses: scalability, resilience, security, operability, cost, and delivery feasibility. This lesson narrows the focus to cloud deployment diagrams. Rather than treating them as collections of vendor icons, you will learn to read them as claims about how a service operates, fails, recovers, and is controlled.
For a Director-level review, the key question is not “Is this a good AWS, Azure, or Google Cloud design?” It is: what customer commitment does this topology support, what can break across its distributed workflow, and what evidence is still needed before we rely on it?
By the end, you should be able to assess a cloud diagram for its operating model, distributed-system risks, security controls, and regional-resilience trade-offs.
A diagram is evidence, not proof
A deployment diagram can show that two regions exist, that data is replicated, or that traffic passes through a load balancer. It cannot, by itself, prove that the system fails over correctly, that replicated data is usable, or that an on-call team can restore service.
Treat each visual element as one of three things:
| What you see | What it establishes | What it does not establish |
|---|---|---|
| Two regional stacks | Infrastructure exists in more than one region. | Both regions can serve full production load. |
| A global routing service | There is a mechanism for directing users to a region. | Health checks detect meaningful failure, clients fail over quickly, or sessions survive. |
| Cross-region data replication | A copy of some data is maintained elsewhere. | The copy is current enough, conflict-free, recoverable, or promoted automatically. |
| A firewall or WAF | A security control is intended at a boundary. | Rules are correctly scoped, monitored, tested, and maintained. |
| Monitoring or logging services | Telemetry is collected. | Alerts are actionable, owned, and connected to response procedures. |
This distinction is particularly useful in interviews and leadership reviews. You do not need to challenge every component choice. You need to identify the unproven claims that matter to the customer and business.
A disciplined diagram review has four passes:
- Operating model: What runs where, who owns it, and which plane is being shown?
- Critical workflows: How does a customer request, change, or recovery action move through the system?
- Trust and failure boundaries: Where can access be abused, data become inconsistent, or a dependency fail partially?
- Resilience economics: What outage does the design handle, how quickly, with how much data loss, and at what ongoing cost?
First pass: identify the operating model
Start by asking what the diagram is attempting to achieve.
A multi-region diagram may represent very different operating models:
- Active-active: Both regions normally serve production traffic. This can reduce failover disruption and improve latency, but it raises complexity around shared state, data consistency, traffic routing, and operational coordination.
- Active-passive: One region normally serves traffic; the other is prepared to take over. This simplifies normal operations, but failover readiness becomes the central risk.
- Warm standby: A secondary environment is running at reduced capacity and must scale during a major failure.
- Pilot light: Critical data and foundational services are live in the recovery region, while most application capacity is started or scaled only during recovery.
- Backup and restore: Data is backed up, but the recovery environment is created or restored after an outage.
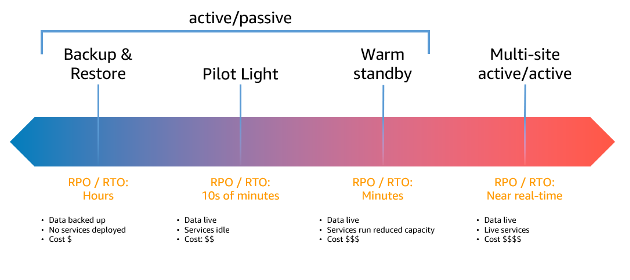
Two terms should anchor this assessment:
- Recovery point objective (RPO): the maximum tolerable amount of data loss, expressed as time. An RPO of fifteen minutes means that, in the worst accepted case, up to fifteen minutes of recent changes may be lost.
- Recovery time objective (RTO): the maximum tolerable time to restore the customer-facing capability after disruption.
These are not platform settings. They are business commitments that must be supported by replication behavior, capacity, automation, operating procedures, and testing.
For example, a database replica in another region may support a low RPO, but only if replication lag stays within the target under real write load. It may still have a long RTO if an operator must manually promote the replica, update routing, validate application behavior, and communicate to customers.
A useful early question is:
Is this architecture optimized for continuous availability, controlled recovery, geographic latency, regulatory separation, or a mixture of these goals?
If the answer is “all of them,” ask the team to prioritize. A design that optimizes every dimension without constraints is often expensive, operationally fragile, or both.
Multi-regional deployment on Compute Engine
Read Google Cloud’s reference architecture to see how a two-region application separates global routing, regional compute tiers, and cross-region data concerns. The provider details are less important than the review habits it makes visible.
In the “Architecture” section, examine the diagram first, then read the component explanations from the operating model. Notice the difference between globally routed traffic, regional application stacks, and the database layer. Then, in “Design considerations”, under “System design” and “Database services,” read the consistency trade-off. Focus on why synchronous replication can improve consistency while adding latency and cost, whereas asynchronous replication can improve performance while allowing temporarily divergent reads.
Identify the planes
The previous lesson introduced the distinction among data, control, and management planes. Apply it to every cloud diagram:
| Plane | Typical function | Review question |
|---|---|---|
| Data plane | Serves the customer workload, such as application requests or database queries. | What must remain available for customers to receive the promised service? |
| Control plane | Creates, configures, scales, or changes resources. | Can provisioning or configuration requests be retried safely and audited? |
| Management plane | Observes, patches, deploys, backs up, recovers, and governs the service. | Can operators detect, diagnose, and recover from failure without unsafe manual actions? |
For infrastructure products, the management plane deserves particular attention. A service might continue serving traffic during a regional disruption, but if the team cannot deploy a fix, restore data, rotate credentials, or understand which customers are affected, the service is not truly resilient.
Second pass: follow the lines, not just the boxes
In distributed systems, the connections carry much of the risk. Two diagrams may contain identical components but behave very differently because one uses synchronous calls while the other uses queues, replicated state, or independent regional processing.
For each critical workflow, trace the full path. A basic review template is:
| Workflow question | What to inspect |
|---|---|
| How does work enter? | DNS, CDN, API gateway, public load balancer, private connection, or partner integration. |
| Where is identity checked? | User authentication, service identity, tenant context, and authorization decisions. |
| Where does work wait or coordinate? | Queues, workflow engines, locks, caches, databases, and rate limits. |
| Where is durable state written? | Primary database, replicated database, object store, audit log, or regional cache. |
| How is completion communicated? | Synchronous response, notification, callback, polling, event, or manual process. |
| How is the workflow repaired? | Retry policy, dead-letter handling, reconciliation job, operator tool, or customer-visible status. |
The most important distributed-system question is often deceptively simple:
If the sender does not receive a response, did the receiver perform the action?
A timeout may mean the receiving service never got the request. It may mean the request completed but the response was lost. Retrying without care can therefore create duplicate patch jobs, duplicate customer notifications, duplicate billing records, or conflicting configuration changes.
For a control workflow that updates infrastructure, look for evidence of:
- Idempotency: Repeating a request produces the intended final state without performing the harmful action twice.
- Bounded retries: Retries have limits, delays, and clear escalation behavior.
- Poison-message handling: Bad or incompatible messages do not retry forever and block useful work.
- Back-pressure: The system slows, queues, rejects, or prioritizes work deliberately when downstream capacity is constrained.
- Correlation and traceability: An operator can follow one customer request across services, regions, queues, and retries.
- Reconciliation: The system can detect and repair gaps between intended state and actual state.
The word “asynchronous” should not end the discussion. It can isolate a caller from a temporarily unavailable dependency, but it introduces new responsibilities: delayed completion, duplicate delivery, ordering, status visibility, and failure repair.
AWS re:Invent 2022 - Are you integrating or building distributed applications? (API308)
In “Are you integrating or building distributed applications?” from AWS Events, the speaker provides a strong visual and operational argument for treating the connections between systems as first-class architecture.
Watch the connections to see why identical components can have different resilience and latency characteristics depending on how they are linked. Then watch distributed failure risks. Focus on infinite loops, hidden topology, poison messages, capped retries, queue pressure, and why observability is a design requirement rather than an afterthought.
A Director does not need to select the exact queueing product or retry interval. The leadership task is to insist that critical workflows have explicit answers to questions such as:
- Which operations may be delayed, and which must fail visibly?
- Which operations may be repeated safely?
- What customer-facing state is authoritative during partial failure?
- Who owns recovery when one team’s event or API causes another team’s backlog?
- What signals tell us that the system is degrading before customers escalate?
Third pass: map the trust boundaries
Cloud diagrams often highlight a public endpoint, firewall, and encrypted connection. That is useful but incomplete. Security review requires identifying who can do what, to which assets, across which boundary.
A practical way to inspect a diagram is to mark four boundary types:
-
Internet to application
Public endpoints are exposed to denial-of-service attempts, web attacks, credential attacks, malformed input, and abuse of public APIs. -
Service to service
Internal traffic can still be dangerous. A compromised service or overly broad workload identity may reach sensitive data, management APIs, or other tenants. -
Region to region
Replicated data, administrative control traffic, and cross-region network connectivity need explicit authorization and logging. -
Human to management plane
Administrator access, break-glass procedures, CI/CD identities, backup operators, and incident responders can carry the largest blast radius.
A diagram should lead you to these questions:
- Are application workloads reachable only through intended entry points, or do virtual machines and containers have direct public exposure?
- Is traffic segmented so that a web tier cannot directly access the database tier?
- Are identities dedicated and least-privileged, or are default/shared service accounts used broadly?
- Are secrets stored and rotated outside application code and deployment configuration?
- Is egress controlled, so compromised workloads cannot freely exfiltrate data or contact arbitrary endpoints?
- Can privileged changes be attributed to a human or automated identity?
- Are security logs centralized and protected even when a primary region is impaired?
The security controls need to be considered as a layered system. A web application firewall can reduce common HTTP-level attacks; it does not replace network segmentation, workload identity, authorization, encryption, audit logs, or incident response.
Multiregion Load Balancing - Azure Architecture Center | Microsoft Learn
Microsoft’s Azure Architecture Center uses a detailed multi-region design to connect global traffic routing, asynchronous database replication, layered security inspection, and recovery responsibility. Read it as a review example, not as a platform prescription.
In “Reliability,” read the multi-region deployment discussion from the recovery trade-offs. Note the distinction between having a secondary region and having a secondary region that is actually ready to serve traffic within the RTO. Then go to “Security” and read from the layered controls. Focus on how WAF, firewall inspection, encryption, and network security groups protect different boundaries rather than duplicating one another.
Fourth pass: test the regional-resilience claim
A multi-region footprint is not automatically a multi-region service. To validate the claim, assess five conditions.
1. Routing can move customers safely
A global DNS or traffic-routing layer may detect a failed endpoint and direct new requests elsewhere. But customer recovery can still be slowed by DNS caching, long-lived connections, session affinity, stale browser state, or health checks that test only a shallow endpoint.
Ask:
- Does the health check represent the critical customer flow or merely confirm that a process is running?
- What happens to in-flight requests when traffic is moved?
- Is routing based on latency, priority, geography, weighted rollout, or manual intervention?
- Can the routing layer accidentally send traffic to a region whose application is healthy but whose database is not?
2. State is usable in the surviving region
This is normally the hardest problem. A secondary region needs more than data copies. It needs a usable view of customer identity, authorization, configuration, workflow status, and relevant operational state.
For each state store, establish:
- whether replication is synchronous or asynchronous;
- the expected and worst-case replication lag;
- whether both regions can write;
- how conflicts are prevented or resolved;
- how failover or promotion happens;
- whether rollback is possible after the original region recovers.
Strong consistency can be appropriate for a safety-critical configuration change or a financial commitment. It may also add cross-region latency, reduce write availability during network disruption, and increase cost. Eventual consistency can support higher performance and regional autonomy, but the product must tolerate temporarily different views of state.
3. Surviving capacity is sufficient
If one region fails, the remaining region must be able to handle the required demand. “Autoscaling exists” is not enough evidence: capacity may be unavailable, quotas may constrain scaling, images may be missing, or database capacity may be fixed.
The relevant decision is usually not whether the secondary region can theoretically handle all traffic. It is whether it can handle the priority workload within the agreed RTO.
4. Dependencies fail independently enough
A two-region application can still have shared dependencies:
- one identity provider;
- one deployment pipeline;
- one secrets-management control plane;
- one third-party API;
- one global database or network configuration;
- one operations team and one escalation path.
These may be reasonable choices, but they must be visible. A Director should ask: “What common dependency can take down both regions, and is that risk accepted, mitigated, or unrecognized?”
5. Recovery is rehearsed
A recovery design is credible only when it has been tested. Evidence might include a game-day result, restore timing, replication-lag measurement, a documented failover runbook, capacity test, or post-incident report.
The review should distinguish:
- Automatic technical recovery: health checks, routing, autohealing, and replication perform as intended.
- Operational recovery: people know how to declare an incident, make the required decisions, communicate with customers, validate data, and return to normal operations.
- Business recovery: customers receive an acceptable service, with clear handling for delayed work, missing updates, or temporary product restrictions.
Worked assessment: a multi-region AWS deployment

Use the diagram above as if it appeared in an architecture review. It shows a substantial regional footprint: each region contains a VPC, application load balancer, containers, container-image registry, Redis cache, DynamoDB, Secrets Manager, security services, and CloudTrail logging. At the global layer, Route 53 and CloudFront direct customer traffic. The diagram also labels cross-region mechanisms for selected services, including S3 replication, container-image replication, a Redis global datastore, DynamoDB global tables, and Secrets Manager replication.
A strong review begins by recognizing what the diagram does well:
- It makes regional duplication explicit for the application stack.
- It shows a global entry layer rather than requiring customers to choose a region manually.
- It recognizes that recovery requires data, images, secrets, caches, audit trails, and security findings—not only compute capacity.
- It includes security and audit components in the topology, rather than adding them after the fact.
However, a Director-level assessment should not conclude, “This is active-active and highly available.” The following questions remain open.
| Review area | Diagram-based assessment | Evidence or decision required |
|---|---|---|
| Operating model | Two regions contain live application infrastructure, but the normal traffic pattern is not explicit. | Confirm whether both regions actively serve customers, whether one is standby, and who can declare regional failover. |
| Workflow behavior | Global routing reaches regional load balancers and containers, but request, session, and background-job behavior are not shown. | Trace login, write, read, asynchronous jobs, and customer notifications during a regional failure. |
| Data consistency | Several data services are replicated, but replication semantics and conflict handling are not visible. | Define the authoritative source for each domain, RPO, write-routing rules, conflict handling, and post-failover reconciliation. |
| Capacity | Both regions have service stacks, but the diagram does not show whether each has enough capacity for regional loss. | Test loss of one region at expected peak load; document degraded features if full capacity is uneconomic. |
| Security | The diagram shows centralized findings and audit logging, but it does not show edge protections, service identities, network segmentation, or egress controls. | Produce a trust-boundary view, least-privilege matrix, logging-retention plan, and incident access model. |
| Operability | Cross-region components increase resilience but also increase coordination work. | Define runbooks for regional failover, secret rotation, cache behavior, deployment rollback, and regional re-entry. |
| Delivery risk | The architecture includes many replicated services, each with configuration and test obligations. | Establish a phased rollout and a recovery-readiness gate before making a broad availability promise. |
Notice the key theme: replication is not the same as recovery.
For example, if two regions can both write to replicated customer state, the design needs a clear answer to what happens when the same customer changes the same object through different regional paths. If only one region accepts writes, the routing and failover rules must ensure that clients do not continue writing to the unavailable or stale path.
Similarly, replicated container images support regional deployment, but they do not prove that the newly deployed application version is compatible with the surviving region’s data state, secrets, configuration, or downstream dependencies.
A concise review conclusion might be:
The topology is a strong starting point for regional resilience because it includes duplicated compute, global traffic entry, several replicated data services, and centralized security signals. Before calling it active-active, the team must demonstrate customer-flow behavior during regional loss, define authoritative state and conflict policies, prove one-region capacity for priority workloads, and rehearse the end-to-end failover and recovery process.
That is both technically credible and suitably executive. It acknowledges the architecture’s strengths while turning ambiguity into owned validation work.
Turn findings into decisions
A review should end with a short decision record rather than an unprioritized list of concerns.
| Decision item | Example |
|---|---|
| Customer commitment | During loss of one region, critical read and control workflows recover within 30 minutes; lower-priority reporting may be delayed. |
| Risk | Asynchronous replication may lose recent configuration updates during a regional outage. |
| Options | Accept a defined RPO; invest in stronger consistency for the critical configuration domain; or restrict writes to one designated region. |
| Decision criterion | Customer safety, contractual commitments, recovery complexity, latency, and ongoing cost. |
| Evidence needed | Replication-lag data under peak load, failover rehearsal, reconciliation test, and capacity test. |
| Accountable owner | Engineering owns technical validation; product owns customer commitments; security owns trust-boundary approval; program leadership owns the readiness gate. |
This makes architecture review part of the operating system you established in the first lesson: explicit outcomes, accountable decisions, visible risks, and meaningful escalation.
Key takeaways
A cloud deployment diagram should be read as a set of operational and business claims, not merely a technical illustration.
- Identify the operating model first: active-active, active-passive, warm standby, pilot light, or backup and restore.
- Trace critical workflows across the lines between components, paying special attention to timeouts, retries, idempotency, queues, state ownership, and observability.
- Review security through trust boundaries, least-privilege identity, network segmentation, controlled egress, secrets, auditability, and incident access.
- Treat regional resilience as a combined claim about routing, usable data, capacity, dependency independence, and rehearsed recovery.
- Distinguish infrastructure replication from customer recovery.
- Convert every material uncertainty into evidence, an accountable decision, and a readiness gate.
In the next lesson, you will shift from design review to delivery health: using service objectives, delivery metrics, release risk, incident evidence, and technical debt to determine whether an engineering organization can reliably deliver and operate what it builds.