Recommended resources
The freely available resources this lesson will direct you to.
In our previous lesson, we explored target encoding as a potent method for converting high-cardinality categorical features into numerical ones, focusing on robust techniques like K-fold and leave-one-out encoding to prevent data leakage. We established that creating features which reliably generalize to unseen data is a cornerstone of production-grade machine learning.
Building on that foundation, this lesson introduces another powerful, target-based encoding strategy: Weight of Evidence (WoE). Originating in the credit risk industry—a domain closely related to your interest in finance—WoE provides not just a way to encode features, but a framework for deeply understanding their relationship with the outcome. We will then extend this concept to calculate the Information Value (IV), a metric that quantifies the predictive power of a variable. This directly addresses today's learning outcome: Apply weight of evidence (WoE) encoding and calculate Information Value (IV) to assess the predictive power of categorical variables.
From Categories to Log-Odds: The Essence of WoE
While target encoding replaces a category with its mean target value, Weight of Evidence takes a different, but related, approach. It quantifies the "weight" of information a category provides in favor of a particular outcome. Specifically, for a binary classification problem (with outcomes "event" and "non-event", or 1 and 0), the WoE for a given category is the natural logarithm of the ratio of the probability of an event to the probability of a non-event.
Mathematically, it's often expressed as the log of the ratio of distributions:
Where:
% Events_iis the proportion of all events in the dataset that fall into category .% Non-Events_iis the proportion of all non-events in the dataset that fall into category .
This formulation is derived from Bayes' theorem and is deeply connected to the concept of log-odds, a fundamental component of logistic regression. Let's explore the foundational concepts and a step-by-step calculation.
Weight of Evidence (WoE) — 1.8.3
This documentation from the Feature-engine library provides a concise introduction to WoE, its origins, and its mathematical basis.
Start by reading the introduction to understand the context of WoE. Then, carefully study the Formulation and Calculation sections. The example breaks down the calculation into clear, manageable steps which we will visualize next.
To make this calculation crystal clear, consider the following table which illustrates the process described in the reading.
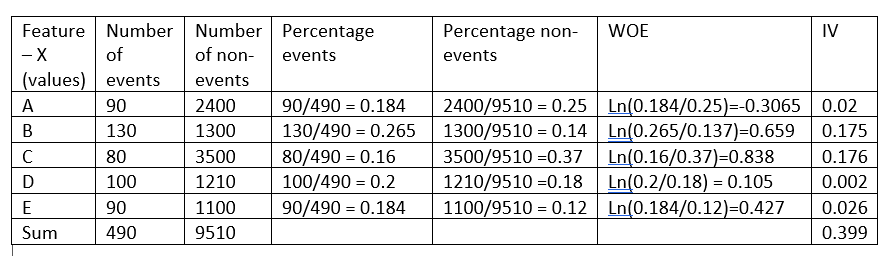
Interpreting the WoE and its Advantages
The WoE value for each category is highly interpretable:
- Positive WoE: The proportion of events is higher than the proportion of non-events for this category. This category is associated with a higher likelihood of the event occurring.
- Negative WoE: The proportion of non-events is higher. This category is associated with a lower likelihood of the event.
- WoE near Zero: The category has roughly equal proportions of events and non-events, providing little information to distinguish between the outcomes.
This transformation has a particularly powerful advantage: it creates a monotonic relationship between the encoded feature and the log-odds of the target variable. For models like logistic regression that assume a linear relationship between predictors and the log-odds of the outcome, WoE-encoded features are ideal. This property often leads to better model performance and more interpretable coefficients.
Weight of Evidence (WoE) — 1.8.3
This section discusses the practical characteristics and benefits of using WoE.
Please read the sections on the Characteristics and Advantages of WoE. Pay close attention to the point about creating monotonic relationships.
Quantifying Predictive Power with Information Value (IV)
While WoE gives us an interpretable encoding for each category, how do we assess the predictive power of the entire feature? This is where Information Value (IV) comes in. The IV is a single number that summarizes the feature's ability to separate events from non-events.
It is calculated by taking a weighted sum of the WoE values across all categories:
The term acts as the weight. If a category contains very different proportions of events and non-events, this difference will be large, and that category's WoE will contribute more significantly to the total IV.
This simple calculation provides a powerful heuristic for feature selection, especially in banking and finance.
General Rules of Thumb for IV:
- < 0.02: Unpredictive
- 0.02 - 0.1: Weakly predictive
- 0.1 - 0.3: Moderately predictive
- 0.3 - 0.5: Strongly predictive
- > 0.5: Suspiciously predictive; may indicate data leakage or a feature that is a proxy for the target.
Interview & Business Context Alert
In a business setting, particularly in risk modeling, presenting the IV for your key features is standard practice. It provides a model-agnostic, easily interpretable measure of feature importance that stakeholders can readily understand. Being able to explain that a feature has a "strong" predictive power based on its IV of 0.35 is more impactful than citing a coefficient from a complex model.
Practical Workflow and Considerations
Applying WoE and IV in practice involves a few critical steps, especially when moving from development to a production pipeline.

As the flowchart suggests, there are some important details to manage:
-
Continuous Variables: WoE is defined for categorical variables. To use it on continuous features (e.g.,
age,income), you must first discretize them into bins. The choice of binning strategy (e.g., equal frequency, equal width, or tree-based binning) is a critical hyperparameter that can significantly affect the resulting IV. The "Optimize Binning" step in the flowchart reflects the importance of finding the right binning strategy. -
Zero Counts: A category might contain zero events or zero non-events, especially if it's rare. This would lead to a division by zero or
log(0)in the WoE calculation. A common fix is to add a small constant (e.g., 0.5) to the counts, a form of Laplace smoothing. Another strategy is to group rare categories into a single "Other" category before calculating WoE. -
Data Leakage: As with target encoding, WoE values must be learned from the training data and then applied to transform the validation and test sets. Calculating WoE on the full dataset before splitting will leak information from the test set into your training features, leading to inflated performance estimates.
Weight of Evidence (WoE) — 1.8.3
This resource discusses the main limitations and extensions of WoE.
Read the section on Limitations to understand the zero-count problem. Then, review the section on Weight of Evidence and Information Value to see the formula for IV.
A Deeper Connection: Information Theory
Your interest in the mathematical underpinnings of these techniques warrants a deeper look. The formula for Information Value is not arbitrary; it has a strong connection to information theory. IV can be shown to be a form of the Jensen-Shannon divergence, which is a symmetrized version of the Kullback-Leibler (KL) divergence.
Here, is the probability distribution of the feature's categories for the event population, and is the distribution for the non-event population. The KL divergence measures how one probability distribution diverges from a second, expected probability distribution. In this context, IV measures the "distance" or dissimilarity between the feature's distribution for events versus non-events. A large distance implies the feature separates the two classes well.
A Walkthrough of Information Value and Weight of Evidence in ...
This blog post provides an excellent, concise explanation of the link between IV and information theory.
Read the section Connection to Information Theory. This formalizes the intuition that IV measures how dissimilar the distributions of "goods" and "bads" are across the feature's categories.
Implementation with feature-engine
Now, let's translate theory into practice. The feature-engine library, which is designed to be compatible with scikit-learn pipelines, provides a convenient WoEEncoder. This is ideal for building the kind of robust, reusable MLOps workflows you're interested in.
The following example demonstrates a full pipeline: handling rare labels, discretizing continuous variables, and finally, applying WoE encoding.
Weight of Evidence (WoE) — 1.8.3
This part of the documentation provides a full, copy-pastable code example using the Titanic dataset.
First, review the Python example that encodes only categorical variables. Notice the use of RareLabelEncoder as a preprocessing step and how to inspect the learned encoder_dict_. Next, study the more advanced example under WoE in categorical and numerical variables. This demonstrates how to build a Pipeline that first uses EqualFrequencyDiscretiser for numerical features before applying WoEEncoder to all variables. This is a robust pattern for production feature engineering.
Conclusion
In this lesson, we moved beyond simple encoding to a method that provides both a transformation and a diagnostic measure. Weight of Evidence and Information Value are staples in industries where model interpretability and feature validation are paramount.
Key Takeaways:
- Weight of Evidence (WoE) transforms categorical features onto a log-odds scale, creating a monotonic relationship with the target that is beneficial for linear models.
- Information Value (IV) is a metric derived from WoE that quantifies the predictive power of a feature, making it a valuable tool for feature selection.
- The application of WoE/IV requires careful preprocessing, including binning for continuous variables and handling of zero-count categories.
- The entire process, from binning to encoding, must be performed within a proper cross-validation or train-test split to prevent data leakage.
- Tools like
feature-engineallow for the clean integration of these steps into reproducible scikit-learn pipelines, which is a step towards an MLOps-centric workflow.
What's Next?
We have now covered two powerful, target-based encoding methods: target encoding (with leakage prevention) and WoE/IV. In the next lesson, we will explore a third, highly innovative approach: CatBoost encoding. CatBoost introduces an "ordered" target statistic that elegantly avoids data leakage without the need for cross-validation folds. This will provide yet another perspective on tackling high-cardinality features.