Recommended resources
The freely available resources this lesson will direct you to.
- Deriving the Mean and Variance of a Continuous Probability Distributionwww.youtube.com
- The Binomial Distribution: Mathematically Deriving the Mean and Variancewww.youtube.com
- Chapter 3: Expectation and Variancewww.stat.auckland.ac.nz
- STAT 24400 Lecture 8 4.1 The Expected Value of a ...www.stat.uchicago.edu
Hello! Welcome to the next lesson in our journey through probability theory.
In our previous lessons, we built a comprehensive toolkit for describing probability distributions using Probability Mass Functions (PMFs), Probability Density Functions (PDFs), and the unifying Cumulative Distribution Function (CDF). We now know how to represent the full behavior of a random variable. Today, we'll shift our focus from describing the entire distribution to summarizing it with a few key numbers. This lesson is dedicated to the learning outcome: Compute the expected value and variance of a random variable from its definition.
We will explore the two most important summary statistics:
- Expected Value: A measure of the distribution's center, often called the mean.
- Variance: A measure of the distribution's spread or dispersion around its mean.
As someone who has worked with data using Python libraries like Pandas and NumPy, you've likely calculated the mean and variance of datasets. Today, we'll delve into the formal theory behind these concepts, grounding them in the language of probability distributions that we have been developing.
1. Expected Value: The Center of Mass
The expected value of a random variable, denoted as or , is the long-run average value of the variable if we were to repeat the experiment an infinite number of times. It represents the "center of mass" of the probability distribution.
Discrete Random Variables
For a discrete random variable that can take on values with corresponding probabilities , the expected value is a weighted average of these values, where the weights are the probabilities.
Definition: The expected value of a discrete random variable is:
where the sum is over all possible values of .
Continuous Random Variables
For a continuous random variable, the concept is analogous. We replace the sum with an integral and the PMF with the PDF.
Definition: The expected value of a continuous random variable with PDF is:
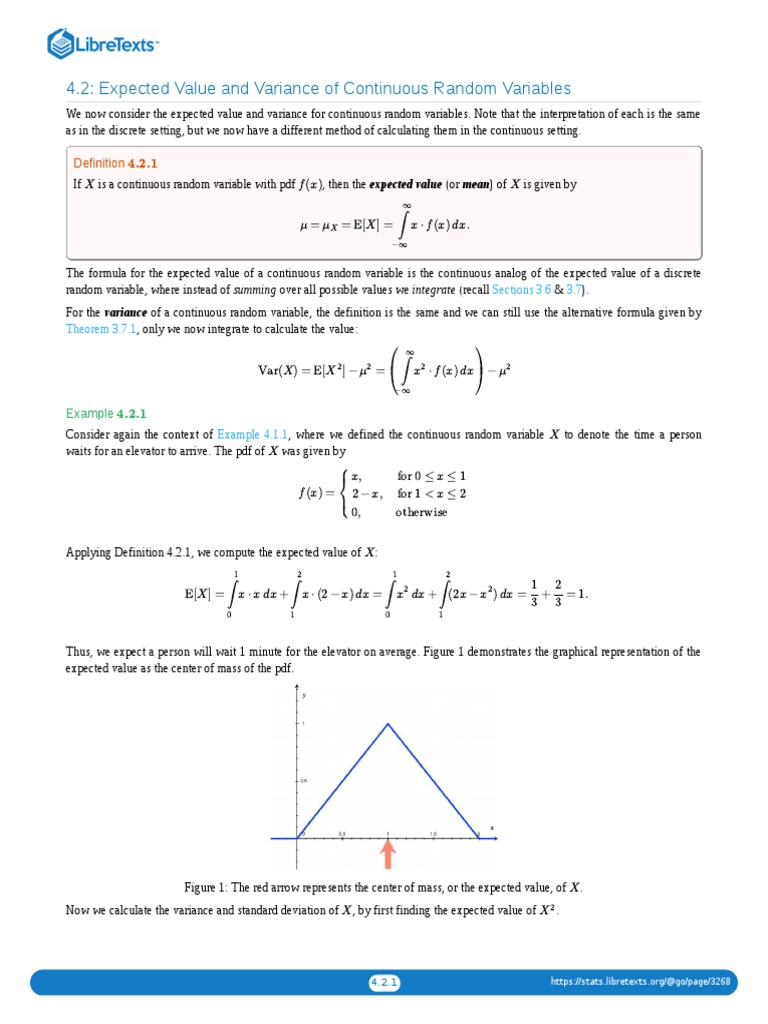
The following reading provides the formal definitions for both cases.
Chapter 3: Expectation and Variance
These lecture notes provide a clear, formal definition for the expected value of both discrete and continuous random variables.
Read the first page of the document (Section 3.1, page 45). Focus on the formal definitions for E(X) for both continuous and discrete random variables.
Now, let's watch a worked example of computing the expected value for a continuous random variable from its PDF. Your calculus background will be helpful here.
Deriving the Mean and Variance of a Continuous Probability Distribution
This video from jbstatistics demonstrates the step-by-step computation of the mean for a given continuous probability distribution, applying the integral definition.
Watch the segment from 00:00 to 03:01. Pay close attention to how the limits of integration are determined by the support of the PDF.
2. Expectation of a Function and Linearity
Often, we are interested in the expected value of a function of a random variable, say . For example, if is the daily return of a stock, might be part of a risk calculation.
The expected value of is computed by weighting by the probability of being at .
- Discrete:
- Continuous:
A critically important property derived from this is the linearity of expectation. For any random variable and constants and , it holds that:
This property is fundamental and simplifies many derivations in probability and statistics. Given your preference for mathematical rigor, working through its proof is a valuable exercise.
These lecture notes from the University of Chicago provide a concise proof for the linearity of expectation for a discrete random variable. The logic extends directly to the continuous case.
Read the slide titled 'Expected Value of aX + b' (slide 21) and follow the short proof. Notice how the properties of summation and the fact that \sum p(x) = 1 are used.
3. Variance: The Measure of Spread
While the expected value tells us about the center of a distribution, it doesn't describe its spread. Two distributions can have the same mean but vastly different shapes. The variance, denoted or , measures the expected squared deviation from the mean.
Definition: Let . The variance of is:
A large variance indicates that the values of are often far from the mean, while a small variance means they are clustered tightly around it. The standard deviation, , is the square root of the variance and is often used because it has the same units as .
The Computational Shortcut for Variance
Calculating variance directly from the definition can be tedious. A more convenient formula is derived by expanding the definition. This is a classic proof that you should know.
Theorem:
Proof:
Let .
\begin{align*} \text{Var}(X) &= E[(X - \mu)^2] \ &= E[X^2 - 2\mu X + \mu^2] \quad \text{(expanding the square)} \ &= E[X^2] - E[2\mu X] + E[\mu^2] \quad \text{(by linearity of expectation)} \ &= E[X^2] - 2\mu E[X] + \mu^2 \quad \text{(since and are constants)} \ &= E[X^2] - 2\mu(\mu) + \mu^2 \quad \text{(since )} \ &= E[X^2] - 2\mu^2 + \mu^2 \ &= E[X^2] - \mu^2 \ &= E[X^2] - (E[X])^2 \end{align*}
This shortcut is almost always used in practice. To compute the variance, you calculate the expected value of and the expected value of , then combine them.
Let's see this shortcut in action by continuing the previous video example.
Deriving the Mean and Variance of a Continuous Probability Distribution
Continuing with the same example, this segment shows how to compute the variance using the shortcut formula we just derived, E[X^2] - (E[X])^2.
Watch from 03:01 to 07:17. Follow the calculation of E[X^2] and see how it's combined with the previously calculated E[X] to find the variance.
Properties of Variance
Just like expectation, variance has a key property related to linear transformations. For constants and :
Notice two things:
- Adding a constant shifts the entire distribution but doesn't change its spread, so has no effect on the variance.
- Multiplying by a constant scales the deviations. Since variance is based on squared deviations, the scaling factor becomes .
The proof is a direct application of the definitions and is an excellent exercise. You can find a clear walkthrough of this proof in the "STAT 24400 Lecture 8" notes on slide 25 (LINK).
Test your understanding!
A discrete random variable has the following Probability Mass Function (PMF):
Compute and .
Show answer
First, we compute the expected value, :
Next, to use the shortcut formula for variance, we need :
Now, we apply the shortcut formula: .
So, the expected value is 1.1 and the variance is 0.49.
Conclusion
In this lesson, we established the formal definitions of expected value and variance, which are fundamental for summarizing probability distributions. You now have the theoretical tools to compute these quantities for any given discrete or continuous random variable.
Key Takeaways:
- Expected Value () is the probability-weighted average of a random variable's possible values.
- Discrete:
- Continuous:
- Variance () is the expected squared deviation from the mean, measuring the spread of the distribution.
- The shortcut formula for variance, , is essential for practical computation.
- The properties of linear transformations are crucial: and .
Preview of the Next Lesson:
We have defined the general methods for computing mean and variance. In the next lesson, we will apply these methods to derive these properties for some of the most important probability distributions in machine learning: the Bernoulli and Binomial distributions. This will move us from general theory to the specific properties of named distributions that you will encounter frequently.