Recommended resources
The freely available resources this lesson will direct you to.
Hello! Welcome to your next lesson in our study of probability theory.
In the last lesson, we established the formal definitions for two of the most important summary statistics of a random variable: its expected value () and its variance (). We saw that these represent the distribution's center of mass and its spread, respectively. Crucially, we derived the powerful computational formula for variance: .
Today, we will apply these tools to two fundamental discrete probability distributions. Your learning outcome for this lesson is to derive the mean and variance of the Bernoulli and Binomial distributions from their Probability Mass Functions (PMFs).
These distributions are not just academic examples; they form the bedrock of modeling binary events, which is central to many machine learning tasks like classification. Given your preference for mathematical rigor, we will derive these properties from first principles.
1. The Bernoulli Distribution
A Bernoulli trial is a single experiment with exactly two possible outcomes: "success" (represented by 1) and "failure" (represented by 0). The Bernoulli distribution models the outcome of such a trial.
Let be a Bernoulli random variable.
- The parameter is , the probability of success, where .
- The outcomes are .
- The Probability Mass Function (PMF) is:
This can be written more compactly as: for .
Deriving the Mean and Variance of a Bernoulli Distribution
Let's now derive the mean () and variance () for a Bernoulli random variable . The following video provides a clear, step-by-step derivation.
The Bernoulli Distribution: Deriving the Mean and Variance
This video from the jbstatistics channel, 'The Bernoulli Distribution: Deriving the Mean and Variance', walks through the complete derivation using the definitions we learned in the previous lesson.
Watch the entire video (it's short). Pay close attention to how the definitions of E[X] and E[X^2] are applied directly to the two-point PMF of the Bernoulli distribution.
Let's summarize the derivation you just watched.
1. Mean (Expected Value):
We apply the definition of expectation for a discrete random variable, .
So, the mean of a Bernoulli distribution is simply the probability of success, .
2. Variance:
We use the computational shortcut, . We already have , so we just need .
Notice that for a Bernoulli variable, . This is a unique property because for .
Now, we substitute into the variance formula:
So, for :
- Mean:
- Variance:
For a textual reference of this proof, you can consult "Probability Notes with Proofs" (LINK), Chapter 14.
2. The Binomial Distribution
The Binomial distribution describes the number of successes in a fixed number of independent Bernoulli trials.
Let be a Binomial random variable, .
- The parameter is the total number of independent trials.
- The parameter is the probability of success on each trial.
- The random variable is the total number of successes, so can take values .
The PMF is given by the formula:
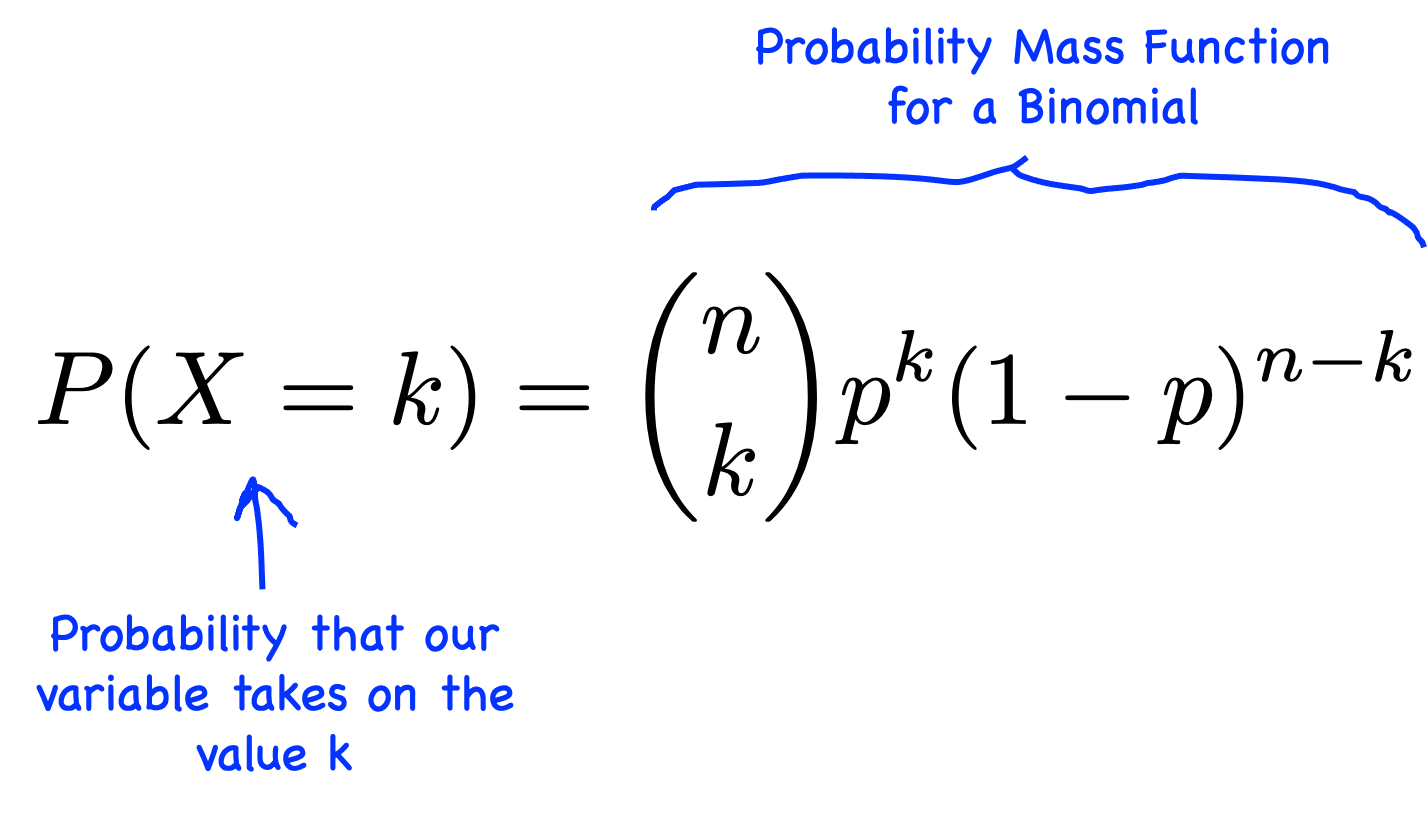
We will derive the mean and variance of the Binomial distribution using two different methods. The first is elegant and relies on the properties of expectation, while the second is a more brute-force algebraic derivation that provides excellent practice with the kind of mathematical manipulation common in machine learning theory.
Method 1: The Sum of Bernoulli Random Variables
The most intuitive way to think about a Binomial random variable is as the sum of independent and identically distributed (i.i.d.) Bernoulli random variables.
Let be i.i.d. random variables, where each . Then .
This video explains how this insight leads to a very straightforward derivation.
The Binomial Distribution: Mathematically Deriving the Mean and Variance
This section of the video 'The Binomial Distribution: Mathematically Deriving the Mean and Variance' presents the 'easy way' to derive the mean and variance by leveraging the relationship between Binomial and Bernoulli distributions.
Watch the segment from 00:47 to 02:44. Focus on how the linearity of expectation and the property of variance for independent variables simplify the problem.
As the video shows, using properties we've learned:
Mean: By the linearity of expectation:
Since for all , we are just summing for times:
Variance: Because the trials (the 's) are independent, the variance of the sum is the sum of the variances:
Since for all :
This is a powerful and elegant proof that highlights the importance of understanding the relationships between distributions.
Test your understanding!
In your house price prediction project, suppose you are evaluating a new feature. You test it on 10 different data splits. You define "success" as the feature improving your model's accuracy. The probability of success on any given split is 0.6, and the outcomes are independent. Let be the total number of successful tests. What are and ? Explain your reasoning.
Show answer
The random variable follows a Binomial distribution, , because it counts the number of successes in a fixed number of independent trials.
Using the formulas derived from the sum of Bernoulli variables:
- Mean: . We expect the feature to improve accuracy on 6 out of the 10 splits.
- Variance: .
Method 2: Direct Derivation from the PMF
Now, we will perform the derivation from first principles, using only the PMF. This is more algebraically intensive but is a fantastic exercise. The key challenge lies in manipulating sums involving binomial coefficients.
To prepare for this, let's first review some essential mathematical tools.
Binomial Distribution Mean and Variance Formulas (Proof)
The article 'Binomial Distribution Mean and Variance Formulas (Proof)' from Probabilistic World starts by laying out some crucial identities. Understanding these is key to following the main proof.
Read the section 'Auxiliary properties and equations'. Pay special attention to the derivation of identity (4): k \cdot \binom{n}{k} = n \cdot \binom{n-1}{k-1}. This identity is the main key that unlocks the proof for the mean.
With that identity in hand, you are now equipped to follow the full derivation. The following resources walk through the proofs for both the mean and the variance. I recommend watching the video for a dynamic explanation and using the article as a detailed reference to ensure you can follow every step.
The Binomial Distribution: Mathematically Deriving the Mean and Variance
Continuing with the jbstatistics video, these sections cover the 'hard way': a direct, rigorous derivation from the PMF.
Watch from 02:44 to the end. First, follow the derivation of the mean (02:44 - 07:46). Notice the use of the binomial coefficient identity and the variable substitution trick. Then, follow the derivation of the variance (07:46 - 13:49), which uses a similar but slightly more complex trick: calculating E[X(X-1)] first.
Binomial Distribution Mean and Variance Formulas (Proof)
This article provides a written, step-by-step account of the same derivations shown in the video. It can be easier to follow complex algebra in a written format.
Read the sections 'Mean of binomial distributions derivation' and 'Variance of binomial distributions derivation'. Use this to solidify your understanding of the steps from the video. Trace each algebraic manipulation carefully.
Let's recap the key steps in the direct proof for the mean, as this is a classic example of this type of derivation:
- Start with the definition: .
- Simplify the sum: The term is zero, so the sum can start from .
- Apply the key identity: Replace with .
- Factor out constants: Pull and one out of the sum to get .
- Change of variables: Let and . This makes the expression inside the sum look familiar.
- Recognize the sum: The summation becomes . This is the sum of all probabilities for a distribution, which equals 1.
- Final result: .
The proof for variance follows a similar pattern but requires the clever step of first computing to simplify the factorial algebra. Mastering these two proofs will significantly strengthen your mathematical toolkit.
Conclusion
In this lesson, you applied the fundamental definitions of mean and variance to derive these properties for two essential discrete distributions.
Key Takeaways:
- For a Bernoulli random variable :
- Mean:
- Variance:
- For a Binomial random variable :
- Mean:
- Variance:
- There are often multiple valid paths to a proof. The elegant method (using sums of i.i.d. variables) provides deep intuition, while the direct algebraic method builds crucial mathematical skills.
Preview of the Next Lesson:
Having mastered these discrete distributions, we will turn our attention to the most important continuous distribution in all of statistics and machine learning: the Gaussian (or Normal) distribution. In the next lesson, you will derive the mean and variance of the univariate Gaussian distribution from its PDF. This will involve similar principles but will require your calculus skills, particularly integration by parts.