Recommended resources
The freely available resources this lesson will direct you to.
Hello! Welcome to your second lesson.
In our last session, we focused on gaining precise control over code execution using the debugger statement and conditional breakpoints. We saw how to pause code only when a specific, complex condition is met. Today, we'll apply a similar principle of "conditional pausing" to one of the most common activities in modern front-end development: network requests.
This lesson focuses on how to configure and use XHR/fetch breakpoints to pause execution when specific API calls are made. As a seasoned front-end lead, you know that debugging issues related to data fetching can be tricky. An incorrect URL, a missing parameter, or an malformed request can originate from anywhere in a large codebase. XHR/fetch breakpoints are designed to solve exactly this problem, allowing you to instantly pinpoint the source code that initiated a specific network request.
Why Use XHR/fetch Breakpoints?
You're already familiar with the Network panel, which provides a detailed log of all requests and their responses. While invaluable, the Network panel shows you what happened after a request was made. What if you need to understand the application's state right before the request was sent?
This is where XHR/fetch breakpoints shine. They pause the JavaScript execution on the exact line of code that calls fetch() or XMLHttpRequest.send(), but only if the request URL matches a pattern you specify. This allows you to:
- Instantly locate the code responsible for an incorrect API call.
- Inspect the call stack to understand the sequence of events that led to the request.
- Examine variables in scope to see how the request URL and payload were constructed.
Configuring an XHR/fetch Breakpoint
Setting up these breakpoints is straightforward. You do this from the Sources panel. The official Chrome documentation provides a clear guide.
Pause your code with breakpoints | Chrome DevTools
Please read this section from the official Chrome DevTools documentation, "Pause your code with breakpoints". It details the steps for creating an XHR/fetch breakpoint.
Focus on the section titled "XHR/fetch breakpoints". It explains the purpose and shows the exact steps to add a breakpoint that triggers on a specific string in the request URL.
To summarize the process:
- Navigate to the Sources panel.
- On the right-hand sidebar, expand the XHR/fetch Breakpoints pane. If it's not visible, you may need to click the
>>icon to show more panes. - Click the
+button to add a new breakpoint. - An input field will appear prompting you to "Break when URL contains:".
- Enter a string that uniquely identifies the request you want to intercept. This could be a path segment (e.g.,
/api/users), a query parameter, or part of a domain. - Press Enter.
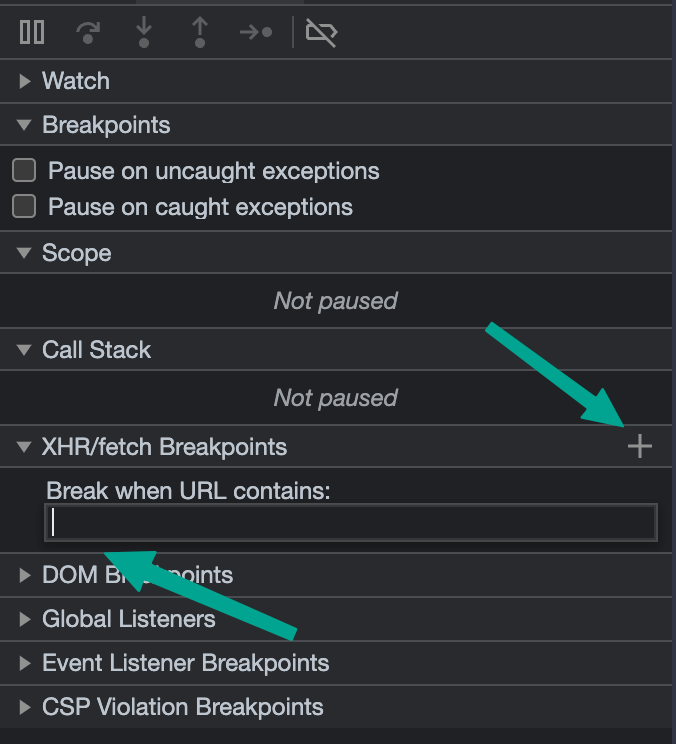
You can also check the "Any XHR or fetch" box to pause on every network request. This can be useful for getting a quick overview, but is often too noisy for targeted debugging. The real power lies in URL-specific breakpoints.
Seeing it in Action
Now, let's watch a quick demonstration. The following video shows how to enable an XHR/fetch breakpoint and how it pauses the code right on the fetch command.
Chrome Dev Tools Source Panel and Breakpoints
This clip from the "Chrome Dev Tools Source Panel and Breakpoints" video by Steve Griffith demonstrates how to set up and trigger an XHR/fetch breakpoint.
Watch the segment from 00:15:08 to 00:16:21. The narrator enables a breakpoint for any fetch call, and you can see the debugger pausing execution on the line containing the fetch command.
As the video shows, once the execution is paused, you have the full power of the debugger at your disposal. This is the crucial moment for investigation. Imagine a scenario where your app is making a faulty request to api/orders/undefined.
By setting a breakpoint for api/orders/, the debugger would pause on the fetch call. You could then:
- Inspect the URL variable in the Scope pane and confirm its value.
- Examine the Call Stack to trace the execution path. By clicking on the functions lower in the stack, you can inspect their scope and find where the
orderIdbecameundefined.
This workflow transforms debugging from a manual code search into a direct, targeted analysis.
Test your understanding!
You're working on an e-commerce site. You notice that when a user with a "premium" account status applies a filter, an API call is made to /api/products?user_type=standard instead of /api/products?user_type=premium.
How would you use an XHR/fetch breakpoint to debug this? What would you look for once the code execution pauses?
Show answer
-
Set the Breakpoint: In the Sources panel, you would add an XHR/fetch breakpoint with the string
/api/products. This will catch all requests to that endpoint. -
Investigate: When the debugger pauses, you would:
- Examine the Call Stack to identify the function that builds and sends the request.
- Trace back up the call stack to find where the
user_typeparameter was determined. - Inspect variables in the Scope pane at each level of the call stack. You would likely find a function that was supposed to check the user's account status but is either failing to do so or receiving incorrect data, resulting in the default
'standard'value being used.
A Note on Specificity: Request vs. Response
It's important to distinguish XHR/fetch Breakpoints from another, similar-sounding option: Event Listener Breakpoints.
- XHR/fetch Breakpoints (what we've discussed today) pause execution before the request is sent. Use this to debug the origin of a request.
- Event Listener Breakpoints > XHR allow you to break on events related to the
XMLHttpRequestlifecycle, such asload(response received),error, orabort. You would use these to debug what happens after the response arrives or if the request fails.
For your goal of finding the source of a network call, XHR/fetch Breakpoints are the correct tool.
Conclusion
Today, we've added a highly efficient tool to your debugging arsenal. You've learned how to configure and use XHR/fetch breakpoints to stop execution precisely when a specific API call is initiated.
Key takeaways:
- XHR/fetch breakpoints pause execution on the line of code that sends a network request, based on a URL substring.
- This allows you to bypass manual code searches and immediately inspect the call stack and variables in scope to understand the context of the request.
- This technique is ideal for debugging issues like malformed URLs, incorrect request parameters, or unexpected API calls.
In our next lesson, we will tackle a closely related topic: debugging asynchronous code by interpreting async stack traces. Since fetch calls are asynchronous, understanding how DevTools presents their execution flow is essential for effective debugging. The call stacks you've seen today will become even more powerful with this added context.