Recommended resources
The freely available resources this lesson will direct you to.
Hello! Welcome to your first lesson in the "Master Chrome DevConsole" course. I'm excited to help you deepen your expertise with these powerful tools.
Given your extensive experience as a lead front-end developer, you're undoubtedly proficient at debugging. This course is designed to refine that skill, introducing advanced techniques that can save you significant time and provide deeper insights into your application's behavior.
In this first lesson, we'll focus on gaining precise control over code execution. You'll learn how to use the debugger statement and set up conditional breakpoints with complex expressions. These techniques allow you to pause your code at the exact moment a specific, often elusive, condition is met, moving you beyond the limitations of standard breakpoints and console.log.
The debugger Statement: Programmatic Breakpoints
While you're used to setting breakpoints visually in the Sources panel, you can also trigger them directly from your code. The debugger statement is a simple yet powerful tool for this. When the browser's JavaScript engine encounters this statement and DevTools is open, it pauses execution just as if you had set a manual line-of-code breakpoint.
This is particularly useful during active development. Instead of searching for a file and line in the Sources panel, you can simply drop debugger; into the code you're working on, refresh the page, and immediately start inspecting.
To get a solid practical overview of this, please watch the following video from freeCodeCamp.org. It does an excellent job of demonstrating how the debugger statement works and why it's a more efficient alternative to scattering console.log calls throughout your code.
Debugging JavaScript - Are you doing it wrong?
This video, "Debugging JavaScript - Are you doing it wrong?", provides a clear, practical demonstration of using the debugger statement.
Please watch from the timestamp 01:30 to 04:11. Pay attention to how the debugger pauses execution and enables inspection of the call stack, scope, and variable values to identify and fix a bug.
As you saw in the video, once paused, you have full access to the debugging environment:
- Scope pane: Inspect all local, closure, and global variables at that exact moment.
- Call Stack: See the chain of function calls that led to this point.
- Console: Execute arbitrary JavaScript in the context of the paused function.
- Step Controls: Step over, into, or out of functions to trace the execution flow line by line.
The official Chrome documentation also provides a concise summary of this feature.
Pause your code with breakpoints | Chrome DevTools
The official Chrome DevTools documentation, "Pause your code with breakpoints", offers a quick reference on the debugger statement.
Read the short section titled "Line-of-code breakpoints in your code". It's a quick confirmation of the concept you just saw in the video.
Conditional Breakpoints: Pausing with Precision
The debugger statement is great, but what if you only want to pause execution under very specific circumstances, like inside a loop that runs hundreds of times? Setting a breakpoint that hits on every iteration is inefficient. This is where conditional breakpoints are invaluable.
A conditional breakpoint is a standard line-of-code breakpoint that you enhance with a JavaScript expression. The debugger will only pause on that line if the expression evaluates to true.
Setting a Conditional Breakpoint
You can set one by following these steps:
- Go to the Sources panel.
- Click the line number where you want to pause. A blue marker for a standard breakpoint appears.
- Right-click the blue marker.
- Select Add conditional breakpoint....
- Enter a JavaScript expression that will evaluate to
trueorfalse. - Press Enter. The marker will turn orange to indicate it's conditional.
This official documentation page explains the process clearly.
Pause your code with breakpoints | Chrome DevTools
Let's return to the official documentation, "Pause your code with breakpoints", to see how to set up conditional breakpoints.
Read the section "Conditional line-of-code breakpoints". It walks through the setup process and shows an example of a breakpoint that only triggers after a certain number of loop iterations.
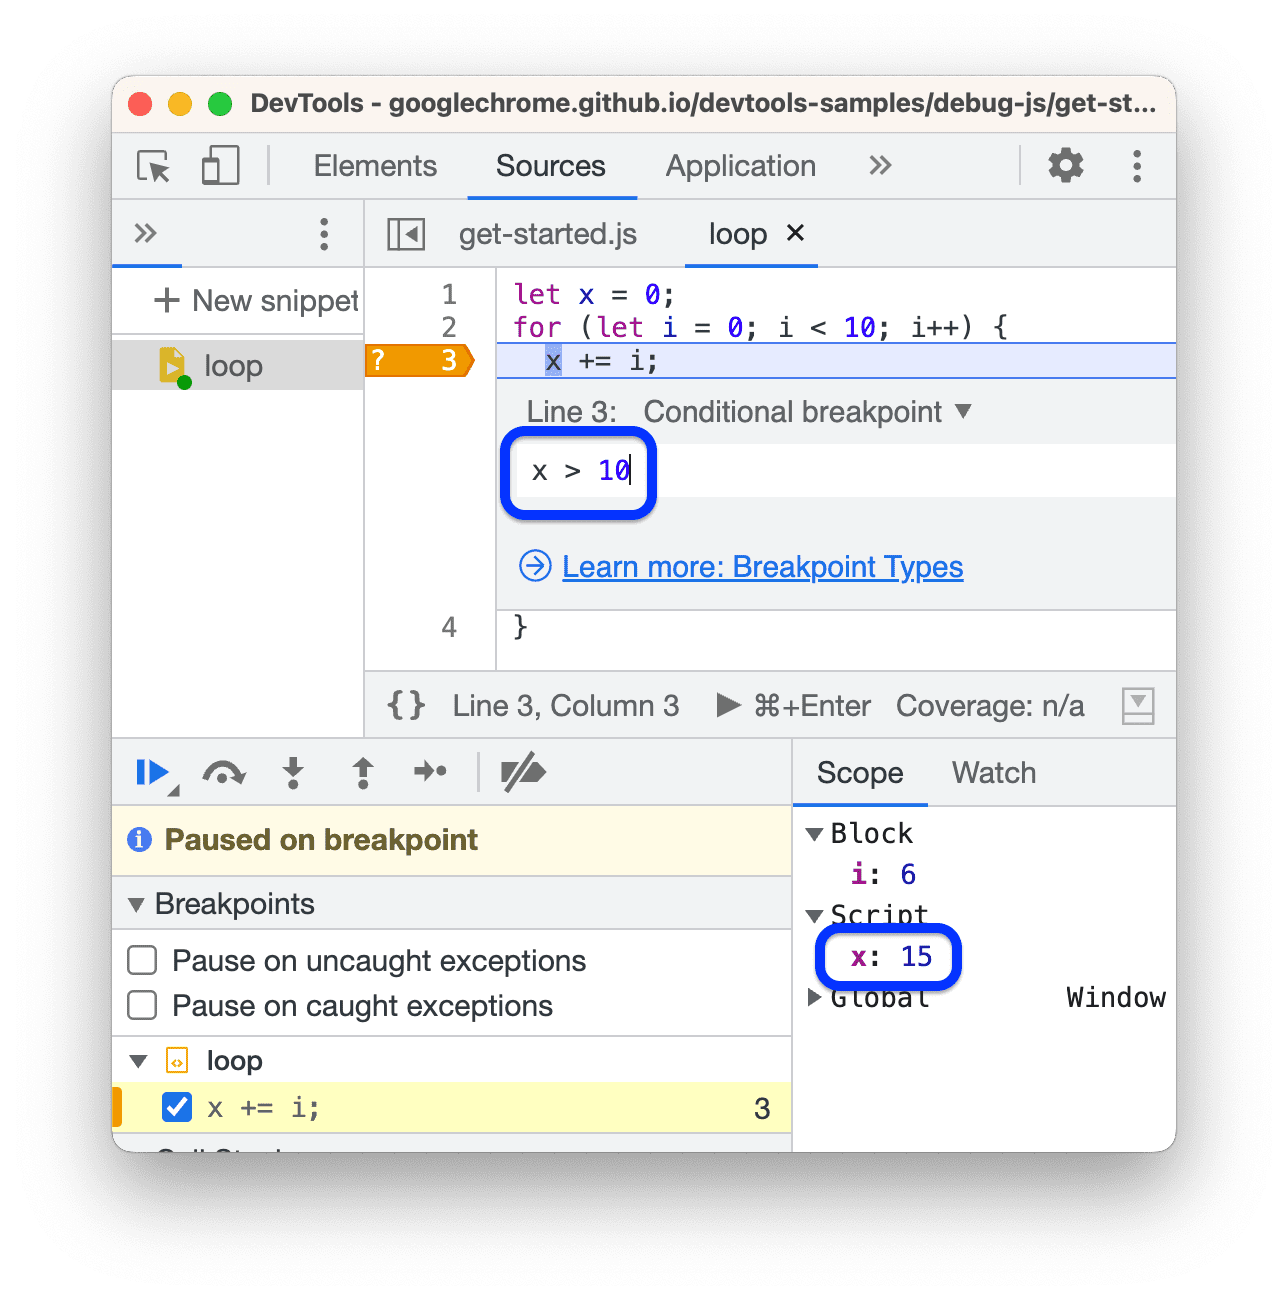
The image below, taken from the documentation you just read, perfectly illustrates this. The code is paused inside a loop, but only at the iteration where the condition x > 10 became true.
Using Complex Expressions
The real power of this feature comes from using complex expressions. The condition isn't limited to simple variable checks. You can use any valid JavaScript that returns a boolean value. This allows you to target highly specific states in your application.
For example, you could pause execution when:
- A specific property on an object has a certain value:
user.id === 'abc-123' && user.state === 'pending' - A function argument is of an unexpected type:
typeof data !== 'string' - An element you are tracking has a particular CSS class:
element.classList.contains('is-hidden') - A value from a function call meets a condition:
calculateTotal(order) > 500
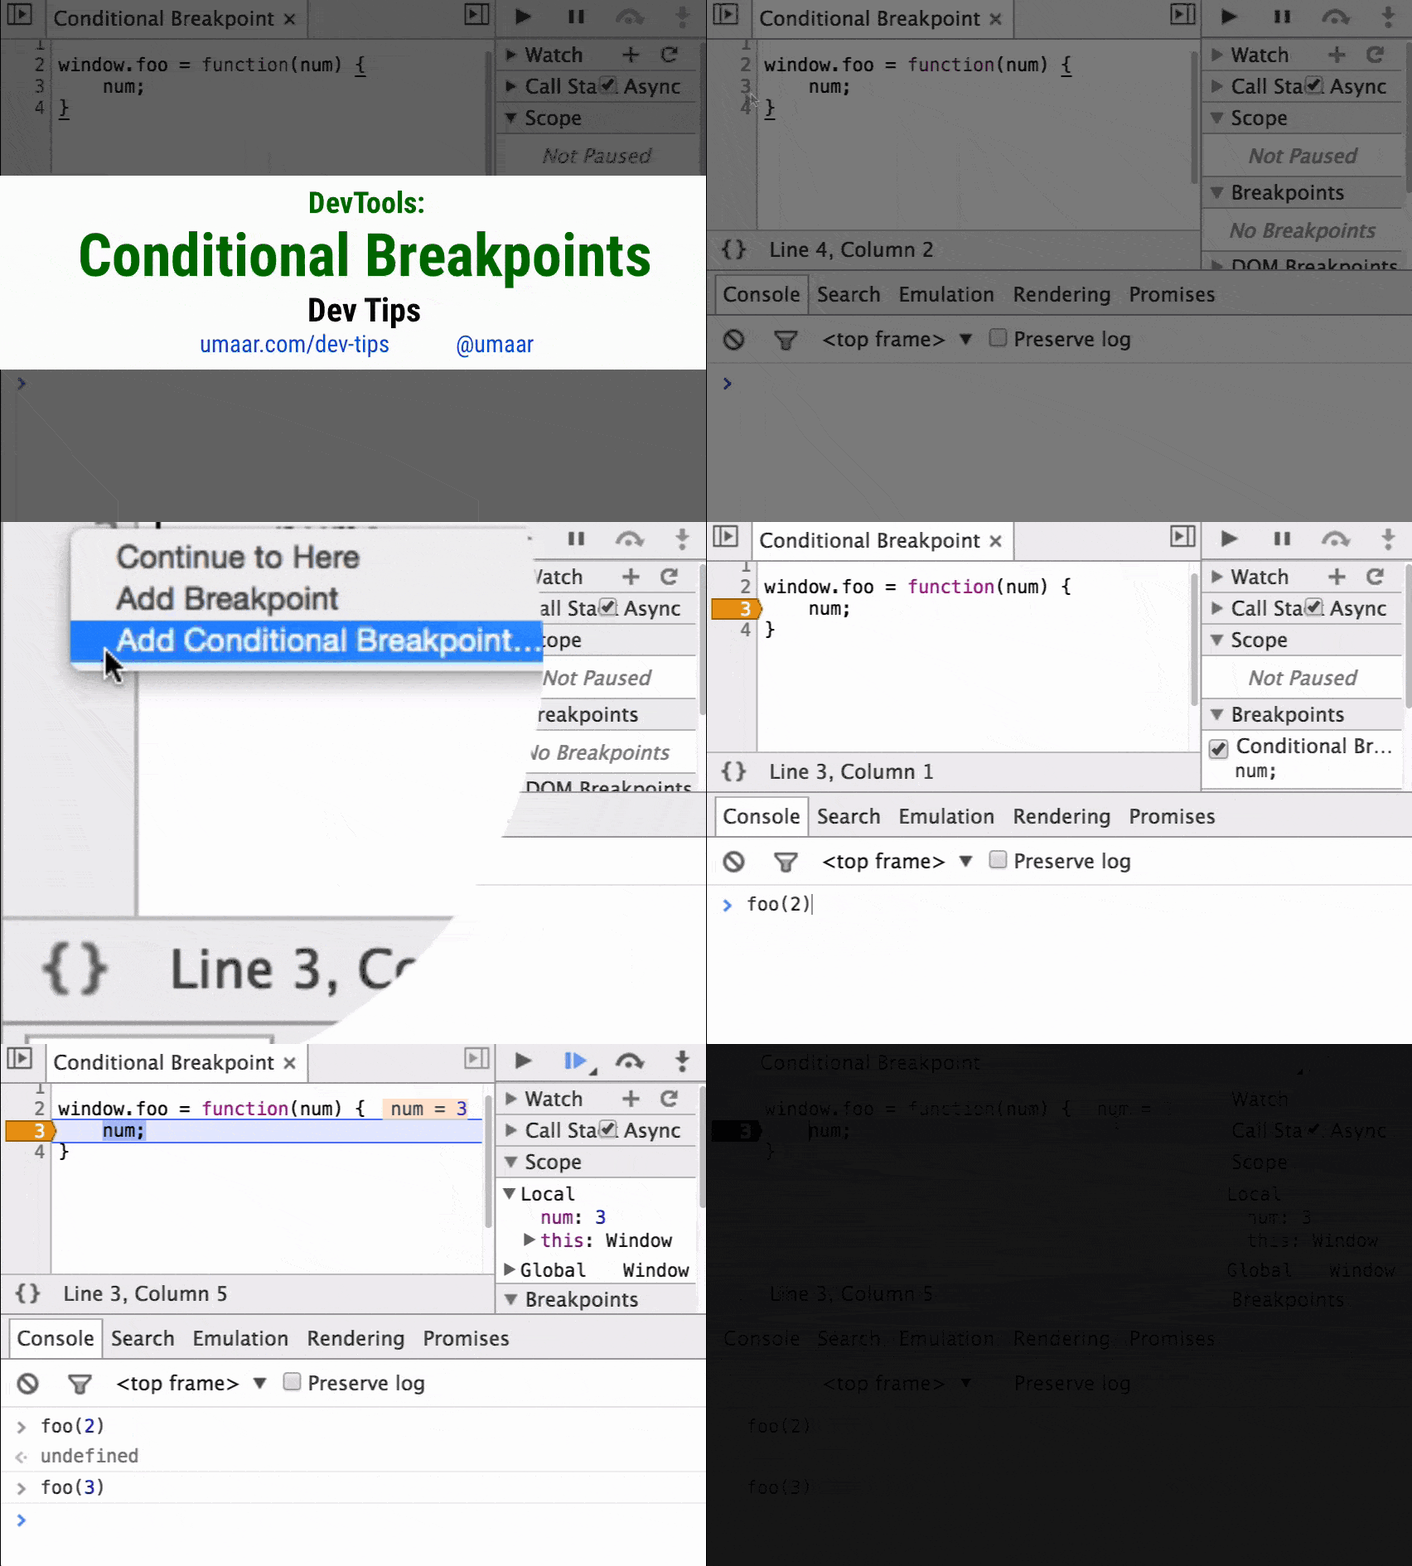
This GIF provides a quick visual of setting a conditional breakpoint in action.
Test your understanding!
Imagine you are debugging a function that processes a large array of items. A bug occurs only when an item with id: 42 also has a status of 'error'. The function looks like this:
function processAllItems(items) {
  for (let i = 0; i < items.length; i++) {
    let currentItem = items[i];
    // Line 4:
    processItem(currentItem);
  }
}
You want to pause execution on Line 4 just before processItem is called for the problematic item. What expression would you use in the conditional breakpoint?
Show answer
You would set a conditional breakpoint on Line 4 with the following expression:
currentItem.id === 42 && currentItem.status === 'error'
This ensures the debugger only pauses when both conditions are met for the currentItem, allowing you to ignore all other iterations and inspect the application state at the exact moment the bug occurs.
Conclusion
In this lesson, we've explored two powerful techniques for controlling code execution during a debugging session.
debuggerstatement: A way to programmatically add a breakpoint directly in your source code, perfect for quick, iterative debugging cycles.- Conditional Breakpoints: A way to make breakpoints "smart" by having them pause only when a specific JavaScript expression is true, which is essential for isolating bugs in repetitive code like loops or frequently called functions.
Mastering these tools will make your debugging process faster and more precise, allowing you to focus on the exact execution paths that matter.
In our next lesson, we will continue exploring advanced breakpoints by looking at XHR/fetch breakpoints, which allow you to pause code execution specifically when an API request is made. This is an incredibly useful technique for debugging issues related to data fetching and network communication in modern web applications.