Recommended resources
The freely available resources this lesson will direct you to.
Hello! Let's dive into our third lesson in the "Advanced Debugging Techniques" module.
In our last session, we mastered XHR/fetch breakpoints, allowing us to pause execution right when a network request is made. Since modern web development relies heavily on asynchronous operations like fetch, it's crucial to understand how to trace their entire lifecycle. Today, we'll build directly on that foundation.
This lesson addresses how to debug asynchronous code by interpreting async stack traces to track promise chains and async/await flows. As an experienced developer, you're well-acquainted with promises and async/await, but you also know that debugging them can be challenging. When a callback or a .then() block executes, the original context that scheduled it is often lost, leaving you with a confusing and incomplete call stack. We're about to fix that.
A Quick Refresher on Asynchronous JavaScript
Before we jump into the debugger, let's quickly realign on the core concepts of asynchronous JavaScript. Your extensive experience means you're already familiar with the event loop, promises, and async/await, but a brief review will help set the stage for the debugging challenges we're about to solve.
The Async Await Episode I Promised
The following video from the Fireship channel provides a fast-paced, high-level overview of these concepts. It's a great refresher on how synchronous and asynchronous tasks are handled, and how promises and async/await fit into the picture.
Please watch from the beginning up to 07:43. Pay attention to: The Event Loop (00:41 - 02:40): The distinction between the main thread, macro tasks (like setTimeout), and micro tasks (like promise resolutions). Promises (02:40 - 05:33): The concept of chaining .then() callbacks. Async/Await (05:33 - 07:43): How this syntax simplifies promise-based code, making it appear synchronous.
The key takeaway is that async/await is "syntactic sugar" over promises. It makes asynchronous code more readable, but it doesn't change the underlying asynchronous nature of the execution. This can sometimes make debugging more confusing, as the code's visual flow doesn't match its execution flow.
The Problem: The Disconnected Call Stack
Let's consider a typical asynchronous scenario:
function initialCall() {
    setTimeout(() => {
        // A breakpoint here will show a very shallow call stack
        console.log('Timeout finished!');
    }, 1000);
}

initialCall();
If you place a breakpoint inside the setTimeout callback, the call stack will be unhelpful. It might show (anonymous function) and some internal browser code. The initialCall function, which is the logical "cause" of this code running, will be nowhere in sight. This is because the callback executes in a new turn of the event loop, long after the initialCall function has completed and been removed from the stack.
The same problem occurs with promises and fetch:
function getUserData() {
    fetch('/api/user/123')
        .then(response => response.json())
        .then(user => {
            console.log(user.name); // Breakpoint here
        });
}
A breakpoint in the final .then() block won't show getUserData in a traditional call stack. You see the result of the async operation, but you've lost the context of what initiated it.
The Solution: Chrome DevTools' Async Stack Traces
Chrome DevTools has a powerful feature designed to solve this exact problem. It can "stitch together" the separate call stacks from different stages of an asynchronous operation.
To enable it, go to the Sources panel and find the Call Stack pane. There, you'll see a checkbox labeled Async. Make sure it's checked.
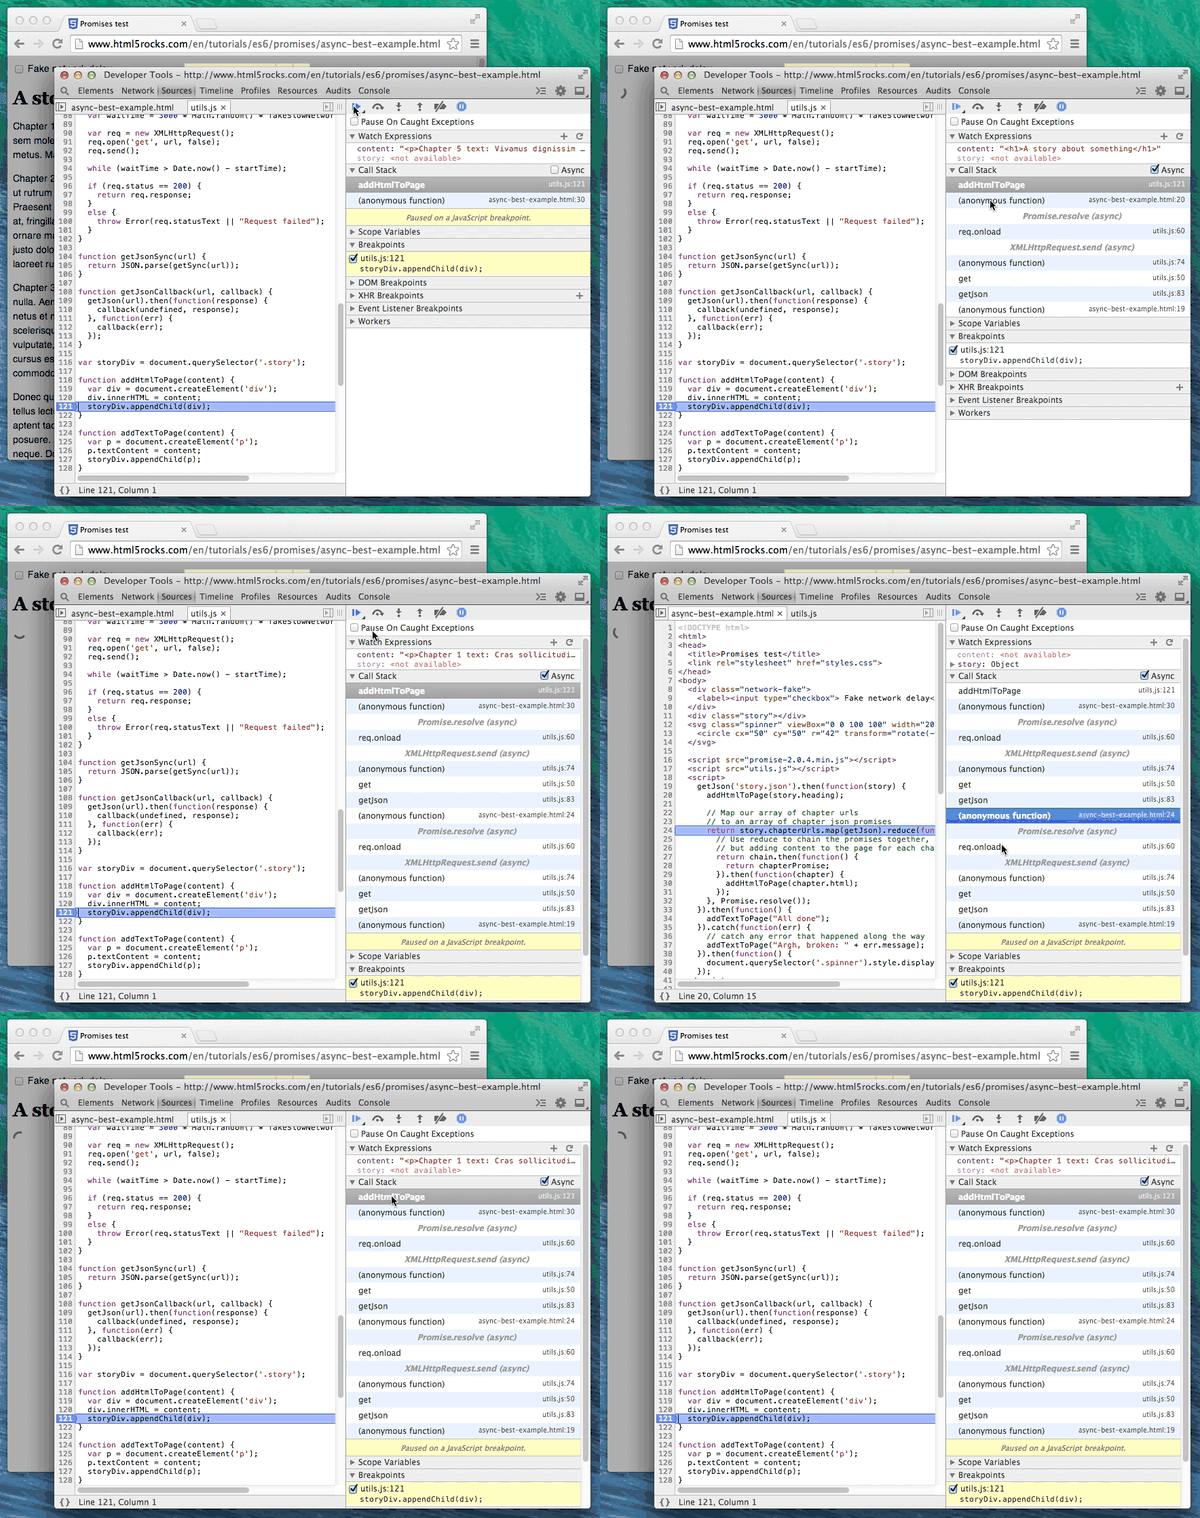
When this feature is active, DevTools instruments asynchronous operations like setTimeout, setInterval, fetch (XMLHttpRequest), requestAnimationFrame, and promise chains. It maintains a link between the code that schedules the async task and the task itself when it eventually runs.
Let's see how this transforms the debugging experience.
Debugging asynchronous JavaScript with Chrome DevTools
This article from the Chrome for Developers blog, "Debugging asynchronous JavaScript with Chrome DevTools," was written when the feature was introduced and provides excellent before-and-after examples.
Please read the following sections: Start with "Enable async debugging in Chrome" to confirm where the setting is. Read "Capture delayed timer events and XHR responses". Notice the stark difference between the call stack with and without the async feature enabled. Finally, read "Unravel chained promise resolutions". This section is directly applicable to debugging modern front-end code that relies on promise chains from APIs like fetch.
As the article demonstrates, the "stitched" call stack is separated by an Async label. Everything above the Async label is the synchronous stack of the current callback. Everything below it is the stack from the previous turn of the event loop where the operation was scheduled. You can even have multiple Async sections, tracing back through a long chain of promises or nested setTimeout calls.
This provides the full "story" of your code's execution. When paused in a .then() block, you can now trace back and see exactly which function call initiated the fetch request in the first place.

Test your understanding!
You are debugging the following code, and you have a breakpoint on the line with debugger;.
async function getOrderDetails(orderId) {
    const orderResponse = await fetch(`/api/orders/${orderId}`);
    const order = await orderResponse.json();
    return order;
}

async function displayOrder() {
    try {
        const order = await getOrderDetails('xyz-123');
        // Some complex logic here...
        const processedItem = order.items[0].name;
        console.log(processedItem);
        debugger;
    } catch (e) {
        console.error("Failed to display order", e);
    }
}

displayOrder();
With the "Async" feature enabled in DevTools, what functions would you expect to see in the Call Stack pane, from top to bottom?
Show answer
You would expect to see a call stack similar to this:
displayOrder(The current synchronous function)Async(The boundary for theawait getOrderDetails)getOrderDetails(The async function that was awaited)Async(The boundary for theawait fetch)(anonymous)(The global script execution)
This shows the complete path: the script called displayOrder, which awaited getOrderDetails, which in turn awaited fetch. You can click on any of these stack frames to inspect the variables in scope at that point in time.
Under the Hood: Catch Prediction
You might have noticed that the "Pause on exceptions" feature has two modes: "Pause on caught exceptions" and "Pause on uncaught exceptions." For synchronous code, this is straightforward. For asynchronous code, it's more complex. How does DevTools know if a rejected promise will eventually be caught by a .catch() block that might be attached later?
The answer is that it uses a set of heuristics to predict the outcome. It analyzes two main sources of information:
- The Call Stack: It looks for
try...catchblocks or if a function seems poised to call.catch()on a returned promise. - The Promise Reaction Tree: It inspects the internal list of reactions (the
.thenand.catchhandlers) attached to a promise to see if a rejection handler exists down the line.
This is a deep topic, but your engineering background might find it interesting. This prediction mechanism is why debugging async exceptions can sometimes feel inconsistent. Understanding that it's a sophisticated "best guess" helps explain the behavior. If you're curious, the article "Catch Prediction in Chrome DevTools" (LINK) provides a fascinating look into how the V8 engine and DevTools collaborate on this.
Conclusion
You've now learned how to bridge the context gap in asynchronous debugging. By enabling async stack traces, you can transform a confusing, shallow call stack into a complete, narrative history of your code's execution.
Key takeaways:
- Standard call stacks are reset on each turn of the event loop, losing the context of what initiated an asynchronous operation.
- The Async checkbox in the Sources > Call Stack pane enables a feature that "stitches" these call stacks together.
- This feature works for promises,
async/await,setTimeout,XHR/fetch,requestAnimationFrame, and more, giving you a full causal chain for debugging. - An
Asynclabel in the call stack marks the boundary between synchronous blocks of execution.
In our next lesson, we'll continue exploring asynchronous debugging by looking at event listener breakpoints. This will allow you to pause execution when a specific DOM event occurs, helping you trace the origin of UI interactions without having to manually find the event handler in your code.