Recommended resources
The freely available resources this lesson will direct you to.
- Y1 25) Causes of Inflation - Demand Pull and Cost Push Inflationwww.youtube.com
- Long-Run Aggregate Supply, Recession, and Inflation- Macro Topic 3.4 and 3.5www.youtube.com
- 11: Inflation, real GDP, monetary policy and fiscal policysocialsci.libretexts.org
- The Aggregate Market – Introduction to Macroeconomicspsu.pb.unizin.org
Introduction
Welcome back! In our last lesson, we used the Aggregate Demand-Aggregate Supply (AD-AS) model to identify recessionary and inflationary gaps. We saw that a positive demand shock can create an inflationary gap, pushing the economy beyond its sustainable potential and leading to upward pressure on prices.
Today, we'll build directly on that foundation to explore the two primary causes of inflation. Our goal is to use the AD-AS model to illustrate demand-pull and cost-push inflation. We will investigate how shifts in either the AD curve or the SRAS curve can lead to a sustained increase in the price level, but with very different consequences for the overall economy.
This lesson will help you diagnose the source of inflation, a critical skill for understanding economic news and the policy debates that follow.
1. Demand-Pull Inflation
The first, and perhaps most intuitive, type of inflation is demand-pull inflation. This occurs when aggregate demand in the economy grows too quickly, outstripping aggregate supply. A common way to describe this is "too much money chasing too few goods."
This process is directly related to the inflationary gap we studied previously. When the AD curve shifts to the right, pushing the short-run equilibrium past the long-run potential output (), firms find that consumers are trying to buy more than they can sustainably produce. This excess demand "pulls" prices up.
Let's watch a video that illustrates this concept and its causes.
Y1 25) Causes of Inflation - Demand Pull and Cost Push Inflation
This video from EconplusDal clearly defines demand-pull inflation, illustrates it using the AD-AS model, and lists the factors that can cause it.
Please watch from the beginning until 02:07. Pay close attention to two key points: How the rightward shift of the AD curve leads to a higher price level. The explanation of why prices rise: there is greater pressure on existing factors of production (like labor and capital), making them scarcer and thus more expensive.
As the video explains, any event that increases the components of aggregate demand (Consumption, Investment, Government Spending, or Net Exports) can trigger demand-pull inflation. Examples include:
- Expansionary Fiscal Policy: Tax cuts or increased government spending.
- Expansionary Monetary Policy: Lower interest rates that encourage borrowing and spending.
- Increased Confidence: A wave of optimism among consumers or businesses.
- A Weaker Currency: Makes exports cheaper and imports more expensive, boosting net exports.
Graphically, the result is straightforward:
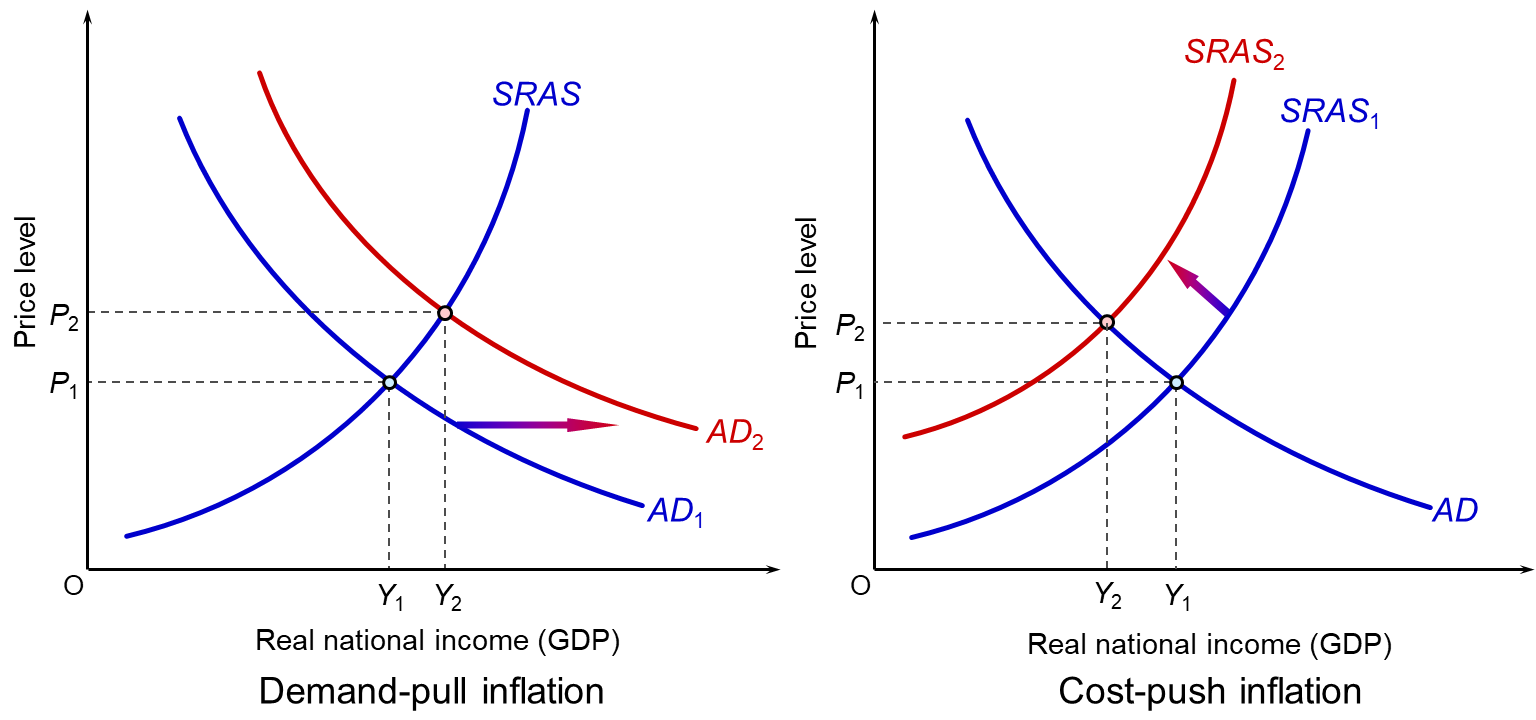
The key takeaway is that demand-pull inflation is associated with an economic boom—output is high and unemployment is low. The inflation is a symptom of an "overheating" economy.
2. Cost-Push Inflation
The second type of inflation, cost-push inflation, is caused by a negative supply shock. This occurs when there is a sudden decrease in the short-run aggregate supply (SRAS), meaning firms are willing and able to produce less output at any given price level.
This decrease in supply is typically caused by an increase in the price of a key input that is used widely across the economy. As production costs rise, firms have no choice but to pass these costs on to consumers in the form of higher prices to protect their profit margins. These higher costs "push" the price level up.
Let's continue with the same video to see how this works.
Y1 25) Causes of Inflation - Demand Pull and Cost Push Inflation
Now, let's look at the other side of the coin: cost-push inflation.
Watch the rest of the video, from 02:07 to the end. Focus on how a leftward shift of the SRAS curve leads to a higher price level and the types of events that cause it.
Common triggers for cost-push inflation include:
- Rising commodity prices: A sharp increase in the price of oil is the classic example. The oil crises of the 1970s are a famous real-world instance of severe cost-push inflation, as detailed in the textbook resource The Aggregate Market.
- Rising nominal wages: Widespread wage hikes not matched by productivity gains can increase costs for firms.
- Increased business taxes: Taxes like VAT (Value Added Tax) increase the cost of doing business.
The graphical result of cost-push inflation is very different from demand-pull inflation. Refer back to the image Demand-pull and cost-push inflation graphs. The panel on the right, 'Cost-push inflation,' shows the SRAS curve shifting to the left (from SRAS1 to SRAS2). Notice the outcome: the price level rises to P2, but real GDP falls to Y2.
This toxic combination of rising inflation and falling output (which leads to higher unemployment) is known as stagflation (stagnation + inflation). It presents a significant dilemma for policymakers, as policies designed to fight inflation (like reducing aggregate demand) would worsen the recession, and policies to fight the recession (like increasing aggregate demand) would worsen inflation.
3. Comparing the Two Types of Inflation
The most critical distinction between demand-pull and cost-push inflation lies in their effect on real output and employment.
- Demand-Pull Inflation: Occurs during an economic boom (Real GDP ↑).
- Cost-Push Inflation (Stagflation): Occurs during an economic downturn (Real GDP ↓).
The following image provides an excellent side-by-side comparison and summary.
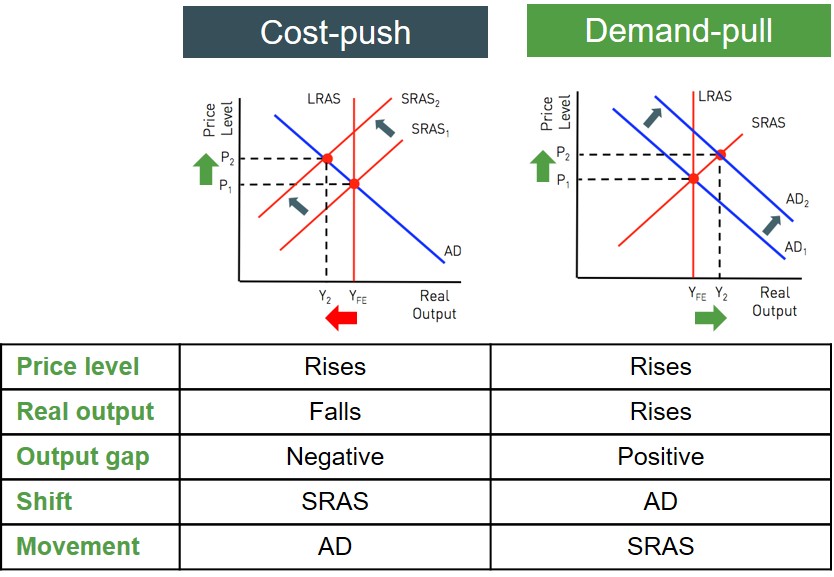
By analyzing both the inflation rate and the growth rate of real GDP, economists can make an educated guess about the source of the inflationary pressures.
Conclusion
In this lesson, you have learned to use the AD-AS model to distinguish between the two primary sources of inflation. This is a fundamental application of the model that brings together many of the concepts we've discussed.
Key Takeaways:
- Demand-Pull Inflation is caused by a rightward shift of the AD curve. It results in a higher price level and higher real output (an inflationary gap).
- Cost-Push Inflation is caused by a leftward shift of the SRAS curve. It results in a higher price level and lower real output (a recessionary gap), a condition known as stagflation.
- The key difference is the impact on real GDP: demand-pull inflation is associated with a boom, while cost-push inflation is associated with a bust.
Preview of the Next Lesson:
Understanding the causes of economic fluctuations and inflation sets the stage for our next topic: government intervention. In the next module, we will begin our study of Fiscal Policy, where we will explore how the government can use its spending and taxation powers to influence aggregate demand, with the goal of closing recessionary or inflationary gaps and promoting economic stability.