Recommended resources
The freely available resources this lesson will direct you to.
- Long-Run Aggregate Supply, Recession, and Inflation- Macro Topic 3.4 and 3.5www.youtube.com
- Demand and Supply Shocks in the AD-AS Modelwww.youtube.com
- Equilibrium in Aggregate Demand-Aggregate Supply (AD- ...fiveable.me
- Recessionary and Inflationary Gaps and Long-Run Macroeconomic ...2012books.lardbucket.org
Introduction
Welcome to our next lesson! In our previous sessions, we built the essential components of the Aggregate Demand-Aggregate Supply (AD-AS) model. You now understand the downward-sloping AD curve, the upward-sloping Short-Run Aggregate Supply (SRAS) curve, and the vertical Long-Run Aggregate Supply (LRAS) curve.
Today, we will bring these three curves together to create a complete picture of the macroeconomy. Our learning outcome is to use the AD-AS model to analyze a recessionary gap and an inflationary gap. We will explore:
- How to identify the economy's short-run and long-run equilibrium.
- What happens when short-run output deviates from the economy's long-run potential.
- How to graphically represent and interpret these deviations, which are central to understanding business cycles.
By the end of this lesson, you'll be able to use the AD-AS model to diagnose the state of an economy—whether it's at its full potential, in a downturn, or overheating.
1. Macroeconomic Equilibrium
In the AD-AS model, the economy can be in two types of equilibrium: short-run and long-run.
- Short-Run Equilibrium: This occurs where the aggregate demand (AD) curve intersects the short-run aggregate supply (SRAS) curve. At this point, the total quantity of goods and services demanded equals the quantity supplied in the short run. The economy will always operate at this intersection.
- Long-Run Equilibrium: This is the ideal state for an economy. It occurs when the short-run equilibrium point also lies on the long-run aggregate supply (LRAS) curve. In this state, AD, SRAS, and LRAS all intersect at the same point.
When in long-run equilibrium:
- The actual output of the economy () is equal to its potential or full-employment output ().
- The unemployment rate is at its "natural rate" (typically 4-6%), which accounts for frictional and structural unemployment.
- The actual price level is equal to the price level that firms and workers expected when they set their wages and prices.
The following resource provides a concise definition and graphical illustration of these equilibrium states.
Equilibrium in Aggregate Demand-Aggregate Supply (AD-AS) Model
Please read this short section to solidify your understanding of short-run and long-run equilibrium.
Read the section titled 'Equilibrium AD-AS Model'. Pay close attention to the graph showing all three curves intersecting at a single point, which represents long-run equilibrium.
However, the economy is often knocked out of this long-run equilibrium by economic "shocks." This leads to situations where the short-run equilibrium output is either less than or greater than the potential output, creating what we call an output gap.
2. The Recessionary Gap (Negative Output Gap)
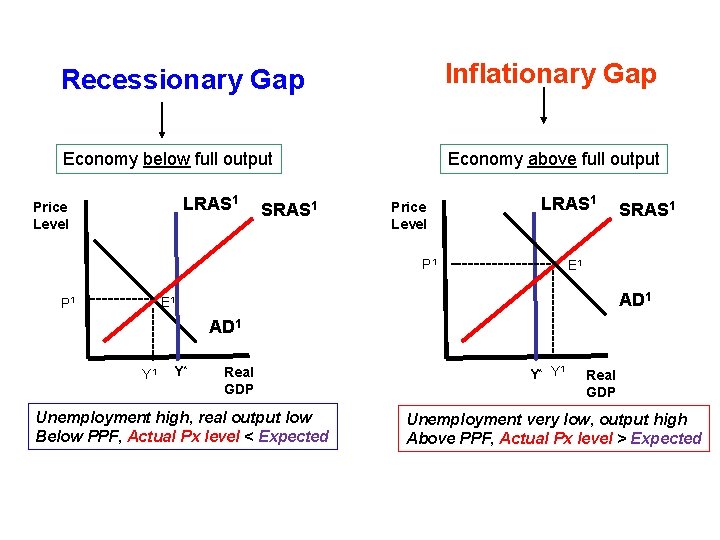
A recessionary gap occurs when the short-run equilibrium output is below the economy's potential output (). This is the macroeconomic condition associated with a recession.
Key characteristics of a recessionary gap:
- High Unemployment: Since firms are producing less than their capacity, they need fewer workers. The unemployment rate rises above the natural rate.
- Low Output: Real GDP is below its potential.
- Downward pressure on prices: With weak demand and high unemployment, there is pressure for wages and prices to fall (or for inflation to slow down).
A recessionary gap is caused by a leftward shift in either the AD curve (a negative demand shock) or the SRAS curve (a negative supply shock). For example, a sharp drop in consumer confidence would decrease consumption, shifting AD left. A sudden spike in oil prices would raise production costs, shifting SRAS left.
The following image provides a clear, static view of a recessionary gap.
To see how this works dynamically and how the economy might adjust, let's watch a video explanation.
Long-Run Aggregate Supply, Recession, and Inflation- Macro Topic 3.4 and 3.5
This video by Jacob Clifford masterfully illustrates the concept of a recessionary gap using the AD-AS model.
Watch the segment from 01:49 to 02:52. Focus on how a decrease in aggregate demand creates a recessionary gap and what happens to output and the price level.
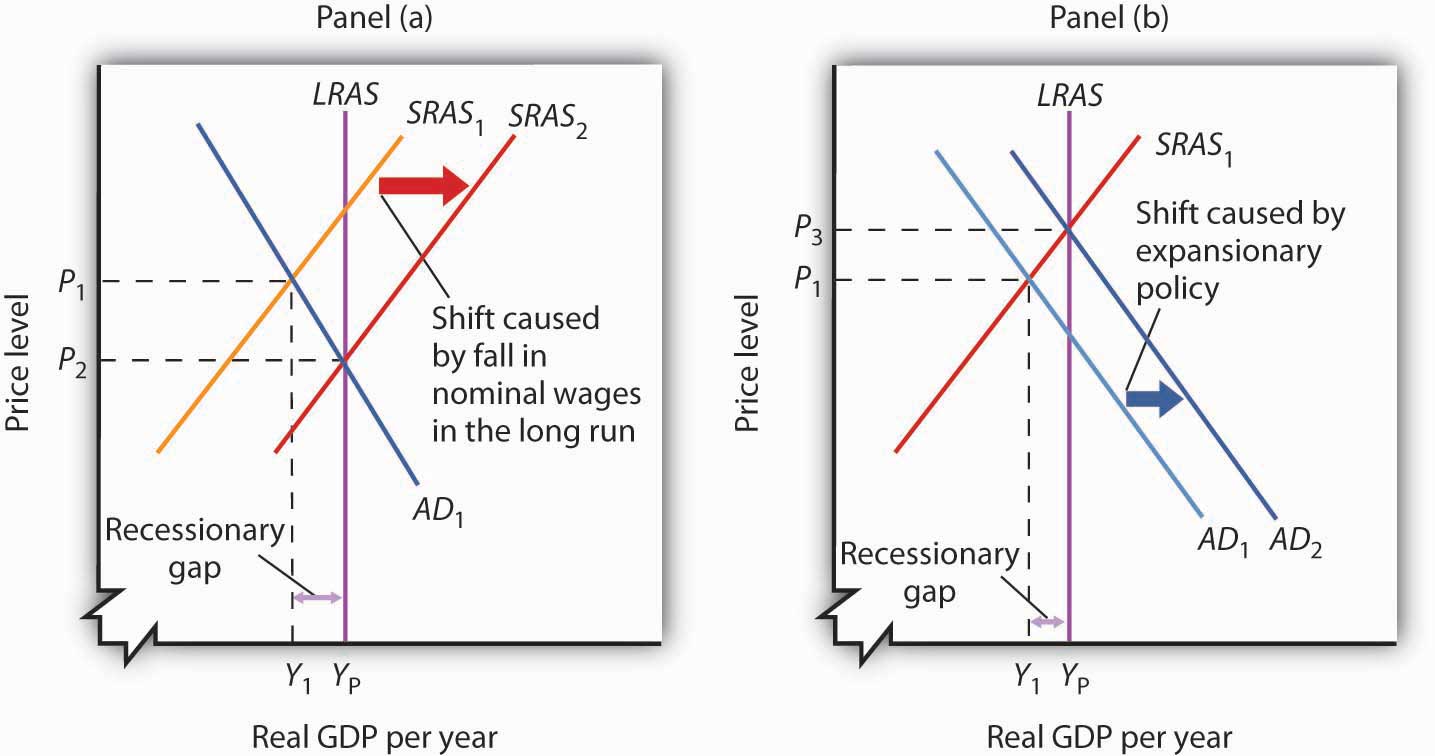
As the video notes, an economy in a recessionary gap can potentially "self-correct." High unemployment puts downward pressure on nominal wages. As wages fall, production costs for firms decrease, shifting the SRAS curve to the right. This process continues until the SRAS curve has shifted enough to restore the economy to its long-run equilibrium at potential output (), albeit at a lower price level.
3. The Inflationary Gap (Positive Output Gap)
An inflationary gap is the opposite scenario: the short-run equilibrium output is above the economy's potential output (). This corresponds to an "overheating" economy.
Key characteristics of an inflationary gap:
- Low Unemployment: To produce beyond its normal capacity, firms must hire more workers, including those who would normally be frictionally or structurally unemployed. The unemployment rate falls below the natural rate.
- High Output: Real GDP is temporarily above its sustainable potential.
- Upward pressure on prices: With strong demand and a tight labor market, there is intense pressure for wages and prices to rise, leading to inflation.
An inflationary gap is typically caused by a positive demand shock, such as a surge in government spending or a boom in the housing market that increases household wealth and consumption.
Refer back to the image Recessionary vs. Inflationary Gaps. The graph on the right illustrates an inflationary gap, where the AD and SRAS curves intersect to the right of the LRAS curve.
Now, let's see the video explanation for this scenario.
Long-Run Aggregate Supply, Recession, and Inflation- Macro Topic 3.4 and 3.5
This next segment from the same Jacob Clifford video explains the inflationary gap.
Watch from 02:52 to 03:33. Observe how an increase in aggregate demand pushes the economy beyond its potential output and how the economy self-corrects.
Like a recessionary gap, an inflationary gap also has a self-correction mechanism. The very low unemployment leads to a labor shortage, forcing firms to compete for workers by offering higher nominal wages. Rising wages increase production costs, shifting the SRAS curve to the left. This shift reduces output and increases the price level, eventually returning the economy to its long-run equilibrium at but with a higher overall price level.
4. Analyzing the Gaps: A Textual Deep Dive
To complement the video explanations, the following reading offers a more detailed, text-based analysis of these concepts. This will be particularly useful for reinforcing the graphical logic.
Recessionary and Inflationary Gaps and Long-Run Macroeconomic Equilibrium
This textbook chapter provides formal definitions and detailed graphical explanations for both recessionary and inflationary gaps, as well as the long-run adjustment process.
Please read the first two sections: 'Recessionary and Inflationary Gaps' and 'Restoring Long-Run Macroeconomic Equilibrium'. Compare the graphs in the text with the ones you saw in the videos.
5. Policy Implications: To Intervene or Not?
The self-correction mechanism we've discussed (where wages adjust and SRAS shifts) is a key concept from classical economic thought. However, this process can be very slow. As John Maynard Keynes famously said, "In the long run, we are all dead."
This brings up a central debate in macroeconomics: should policymakers wait for the economy to self-correct, or should they intervene?
- Nonintervention Policy: Allow falling wages in a recession (or rising wages in a boom) to shift the SRAS curve and close the gap over time.
- Stabilization Policy: Use government policy to shift the AD curve to close the gap more quickly.
- In a recessionary gap, the government can use expansionary policy (cutting taxes or increasing government spending) to shift AD to the right.
- In an inflationary gap, the government can use contractionary policy (raising taxes or cutting government spending) to shift AD to the left.
The following image perfectly illustrates these two approaches for closing a recessionary gap.
We will dive deep into these fiscal and monetary policies in future modules. For now, it is important to recognize that these gaps are the very reason such policies are debated and implemented.
Conclusion
In this lesson, we put the AD-AS model to work, using it to analyze the health of an economy. You now have a powerful graphical framework for understanding business cycles.
Key Takeaways:
- Long-Run Equilibrium is the economy's ideal state, where output is at its potential () and unemployment is at its natural rate.
- A Recessionary Gap occurs when short-run equilibrium output is below potential (). This is characterized by high unemployment and is caused by a negative demand or supply shock.
- An Inflationary Gap occurs when short-run equilibrium output is above potential (). This is characterized by very low unemployment and rising inflation, often caused by a positive demand shock.
- Gaps can be closed over the long run through self-correction (shifts in SRAS due to wage changes) or more quickly through stabilization policy (shifts in AD via government action).
Preview of the Next Lesson:
The shocks that create these gaps are also the root causes of inflation. In our next lesson, we will use the AD-AS model to specifically illustrate the difference between demand-pull inflation (caused by rightward shifts of the AD curve) and cost-push inflation (caused by leftward shifts of the SRAS curve).