Recommended resources
The freely available resources this lesson will direct you to.
Introduction
Hello! Welcome back to our study of production costs. In our last few lessons, you’ve become familiar with two very important concepts:
- From our lesson on production, you learned about the marginal product of labor (MP) and the law of diminishing marginal returns, which gives the MP curve its characteristic "hill" shape.
- In our most recent lesson, you learned to graph the marginal cost (MC) curve and saw that it typically has a "U" shape.
As I hinted at the end of our last session, the fact that the MP curve is shaped like a hill and the MC curve is shaped like a U is no coincidence. They are, in fact, two sides of the same coin.
Today's lesson directly addresses the learning outcome: to explain the relationship between the marginal cost curve and the marginal product curve. We will formally connect a firm's production technology (what it gets from its workers) to its cost structure (what it costs to produce more output). This connection is fundamental to understanding how firms make decisions.
1. The Core Relationship: Productivity and Cost
The link between marginal product and marginal cost is intuitive. Think about it from a firm's perspective:
- When you hire a new worker and they are highly productive (i.e., they have a high marginal product), they add a lot of output for the cost of their wage. This means the cost of producing each of those additional units is low.
- Later, due to diminishing returns, a new worker you hire is less productive (they have a low marginal product). You still pay them the same wage, but they add less output. This means the cost of producing each of those few additional units is high.
In short:
- Increasing marginal product leads to decreasing marginal cost.
- Diminishing (decreasing) marginal product leads to increasing marginal cost.
This creates the inverse, or "mirror image," relationship between the two curves.
2. Seeing it in Action: An Intuitive and Numerical Explanation
Let's watch a short video that brings this concept to life. It starts with the core intuition and then walks through a clear numerical example to prove the relationship.
Marginal Product and Marginal Cost Review
This video from Jacob Clifford's ACDC Econ is excellent for building a strong foundational understanding of the MP-MC link.
Please watch the entire video (it's about 4.5 minutes long). The first minute (0:00-1:44) covers the core intuitive and graphical relationship we just discussed. The remainder of the video (1:44-4:48) provides a step-by-step numerical example. Pay close attention to how he uses the wage and the marginal product to calculate the marginal cost for each new batch of output. This aligns well with your preference for quantitative examples.
3. The Formal Relationship: A Simple Equation
The video demonstrated this inverse relationship with numbers. We can formalize this with a simple but powerful formula.
Remember that marginal cost is the change in total cost divided by the change in quantity:
In the short run, when a firm hires more labor to produce more output, the change in total cost () is the cost of the additional labor, which is the wage () paid to the new worker(s). The change in quantity () is the additional output they produce, which is their marginal product ().
If we consider hiring just one more unit of labor, the formula becomes:
This equation makes the inverse relationship crystal clear. Since the wage () is a constant price for the input, if Marginal Product () in the denominator goes up, Marginal Cost () must go down. Conversely, when goes down (due to diminishing returns), must go up.
To confirm this, let's look at a textual resource that states this relationship concisely.
Production Function - ReviewEcon.com
The website ReviewEcon.com provides a clear summary of the production function and explicitly states the MC = W/MP formula.
Please read the two paragraphs in the middle of the page, starting from 'Note: Diminishing Marginal Returns...' and ending with '...when MP is falling, MC is rising.' This section directly presents and explains the formula linking wage, marginal product, and marginal cost.
4. Visualizing the "Mirror Image"
The inverse relationship means that if we plot the two curves, with the MP curve on top and the MC curve on the bottom, they should mirror each other.
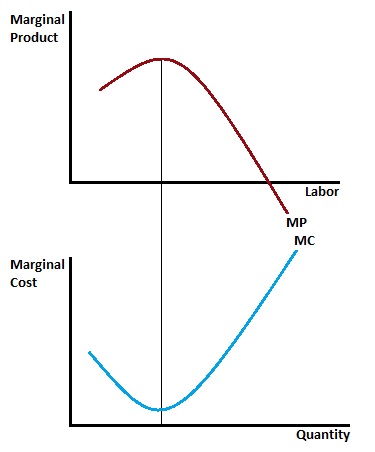
To further solidify this graphical understanding, the following video segment describes the curves as "mirror reflections" and breaks down the graph into stages corresponding to increasing and diminishing returns.
Y2 3) Marginal and Average Cost Curves (MC & AC)
This clip from EconplusDal provides an excellent analysis of the graphical relationship.
Please watch the segment from 3:03 to 4:59. Focus on how the presenter divides the MC curve into 'Part 1' (where MP is rising and MC is falling) and 'Part 2' (where MP is falling and MC is rising). This reinforces the connection to the law of diminishing returns.
This direct link between the physical process of production (marginal product) and the financial costs (marginal cost) is a cornerstone of the theory of the firm, and we will build on it in future lessons.
Conclusion
In this lesson, we have forged the crucial link between production and costs. You now understand not only what the marginal cost curve looks like, but why it has its characteristic U-shape.
Here are your key takeaways:
- Inverse Relationship: The relationship between marginal product (MP) and marginal cost (MC) is inverse. When one is rising, the other is falling.
- The Cause: This relationship is driven by the law of diminishing marginal returns. Initially, specialization leads to increasing MP and falling MC. Eventually, fixed inputs become a constraint, causing diminishing MP and rising MC.
- The Formula: The relationship can be expressed by the formula , where is the wage rate.
- Graphical Mirror: The MP and MC curves are graphical "mirror images." The maximum point of the MP curve corresponds to the minimum point of the MC curve.
We have now thoroughly covered the mechanics of a firm's costs in the short run. In our next lesson, we will shift our focus to the long run, where all inputs are variable. We will introduce the Long-Run Average Total Cost (LRATC) curve and explore the important concepts of economies and diseconomies of scale, which help explain the size and structure of firms in an industry.