Recommended resources
The freely available resources this lesson will direct you to.
Introduction
Hello! In our last lesson, we focused on the "big picture" of a firm's costs, learning how to calculate and graph total fixed cost (TFC), total variable cost (TVC), and total cost (TC). We established that the shape of the total cost curves is a direct result of the law of diminishing marginal returns.
Today, we'll zoom in from the total to the per-unit level. While total costs are important, firms often make crucial decisions—like what price to charge or how much to produce—by thinking about costs on a per-unit basis. Our goal is to calculate and graph average fixed cost (AFC), average variable cost (AVC), average total cost (ATC), and marginal cost (MC). These four curves are among the most important tools in microeconomics, and mastering them is essential for understanding how firms behave.
1. Defining the Per-Unit Costs
Let's begin by defining our four new cost measures. They are all derived from the total cost concepts you learned in the previous lesson.
- Average Fixed Cost (AFC): The fixed cost per unit of output.
- Average Variable Cost (AVC): The variable cost per unit of output.
- Average Total Cost (ATC): The total cost per unit of output. It can be calculated in two ways:
- Marginal Cost (MC): The additional cost of producing one more unit of output. Since fixed costs don't change with output, marginal cost is also the change in variable cost from one more unit.
(Where means "change in").
These formulas are the building blocks for this lesson. You can find them neatly summarized in the resource below.
Cost Curves – Intermediate Microeconomics
For a quick reference, the 'Cost Curves – Intermediate Microeconomics' textbook provides a clear list of these formulas.
In this resource, navigate to the 'Equations' section and review the formulas listed under 'Short Run Cost Equations'. You've already seen the total cost formulas; focus now on the definitions for AFC, AVC, ATC, and MC.
2. From Total Costs to Per-Unit Costs: A Worked Example
Now, let's see how to apply these formulas. The best way to understand the relationships is to work through an example, starting with the total costs and systematically calculating each per-unit cost.
The following video provides a detailed, step-by-step walkthrough of this process using a data table. As you watch, I encourage you to pause and try the calculations yourself to solidify your understanding.
Chapter 13: The Cost of Production
In 'Chapter 13: The Cost of Production', Dr. Azevedo starts with a table of output and total cost, and then meticulously calculates AFC, AVC, ATC, and MC for each level of output.
Watch the segment from 40:39 to 53:50. Pay close attention to how each column in the table is derived from the previous ones. Notice the important identity he points out: ATC = AFC + AVC.
3. Graphing the Per-Unit Cost Curves
With the calculations complete, we can now visualize these costs by plotting them on a graph. The shapes of these curves are not random; they reveal fundamental properties of a firm's production technology.
The next part of the video you just watched does exactly this, plotting the data from the table and explaining the economic intuition behind the shape of each curve.
Chapter 13: The Cost of Production
Let's continue with Dr. Azevedo's lecture to see how the numbers from the table translate into the standard cost curve graph.
Watch from 53:50 to 1:02:48. Focus on these key features: The shape of each curve: Why does AFC always fall? Why are ATC and AVC 'U-shaped'? The relationship between the curves: Why does the MC curve intersect both the AVC and ATC curves at their lowest points? The GPA analogy he uses is a very powerful way to understand this mathematical relationship.
After watching the video, let's summarize the key graphical relationships.
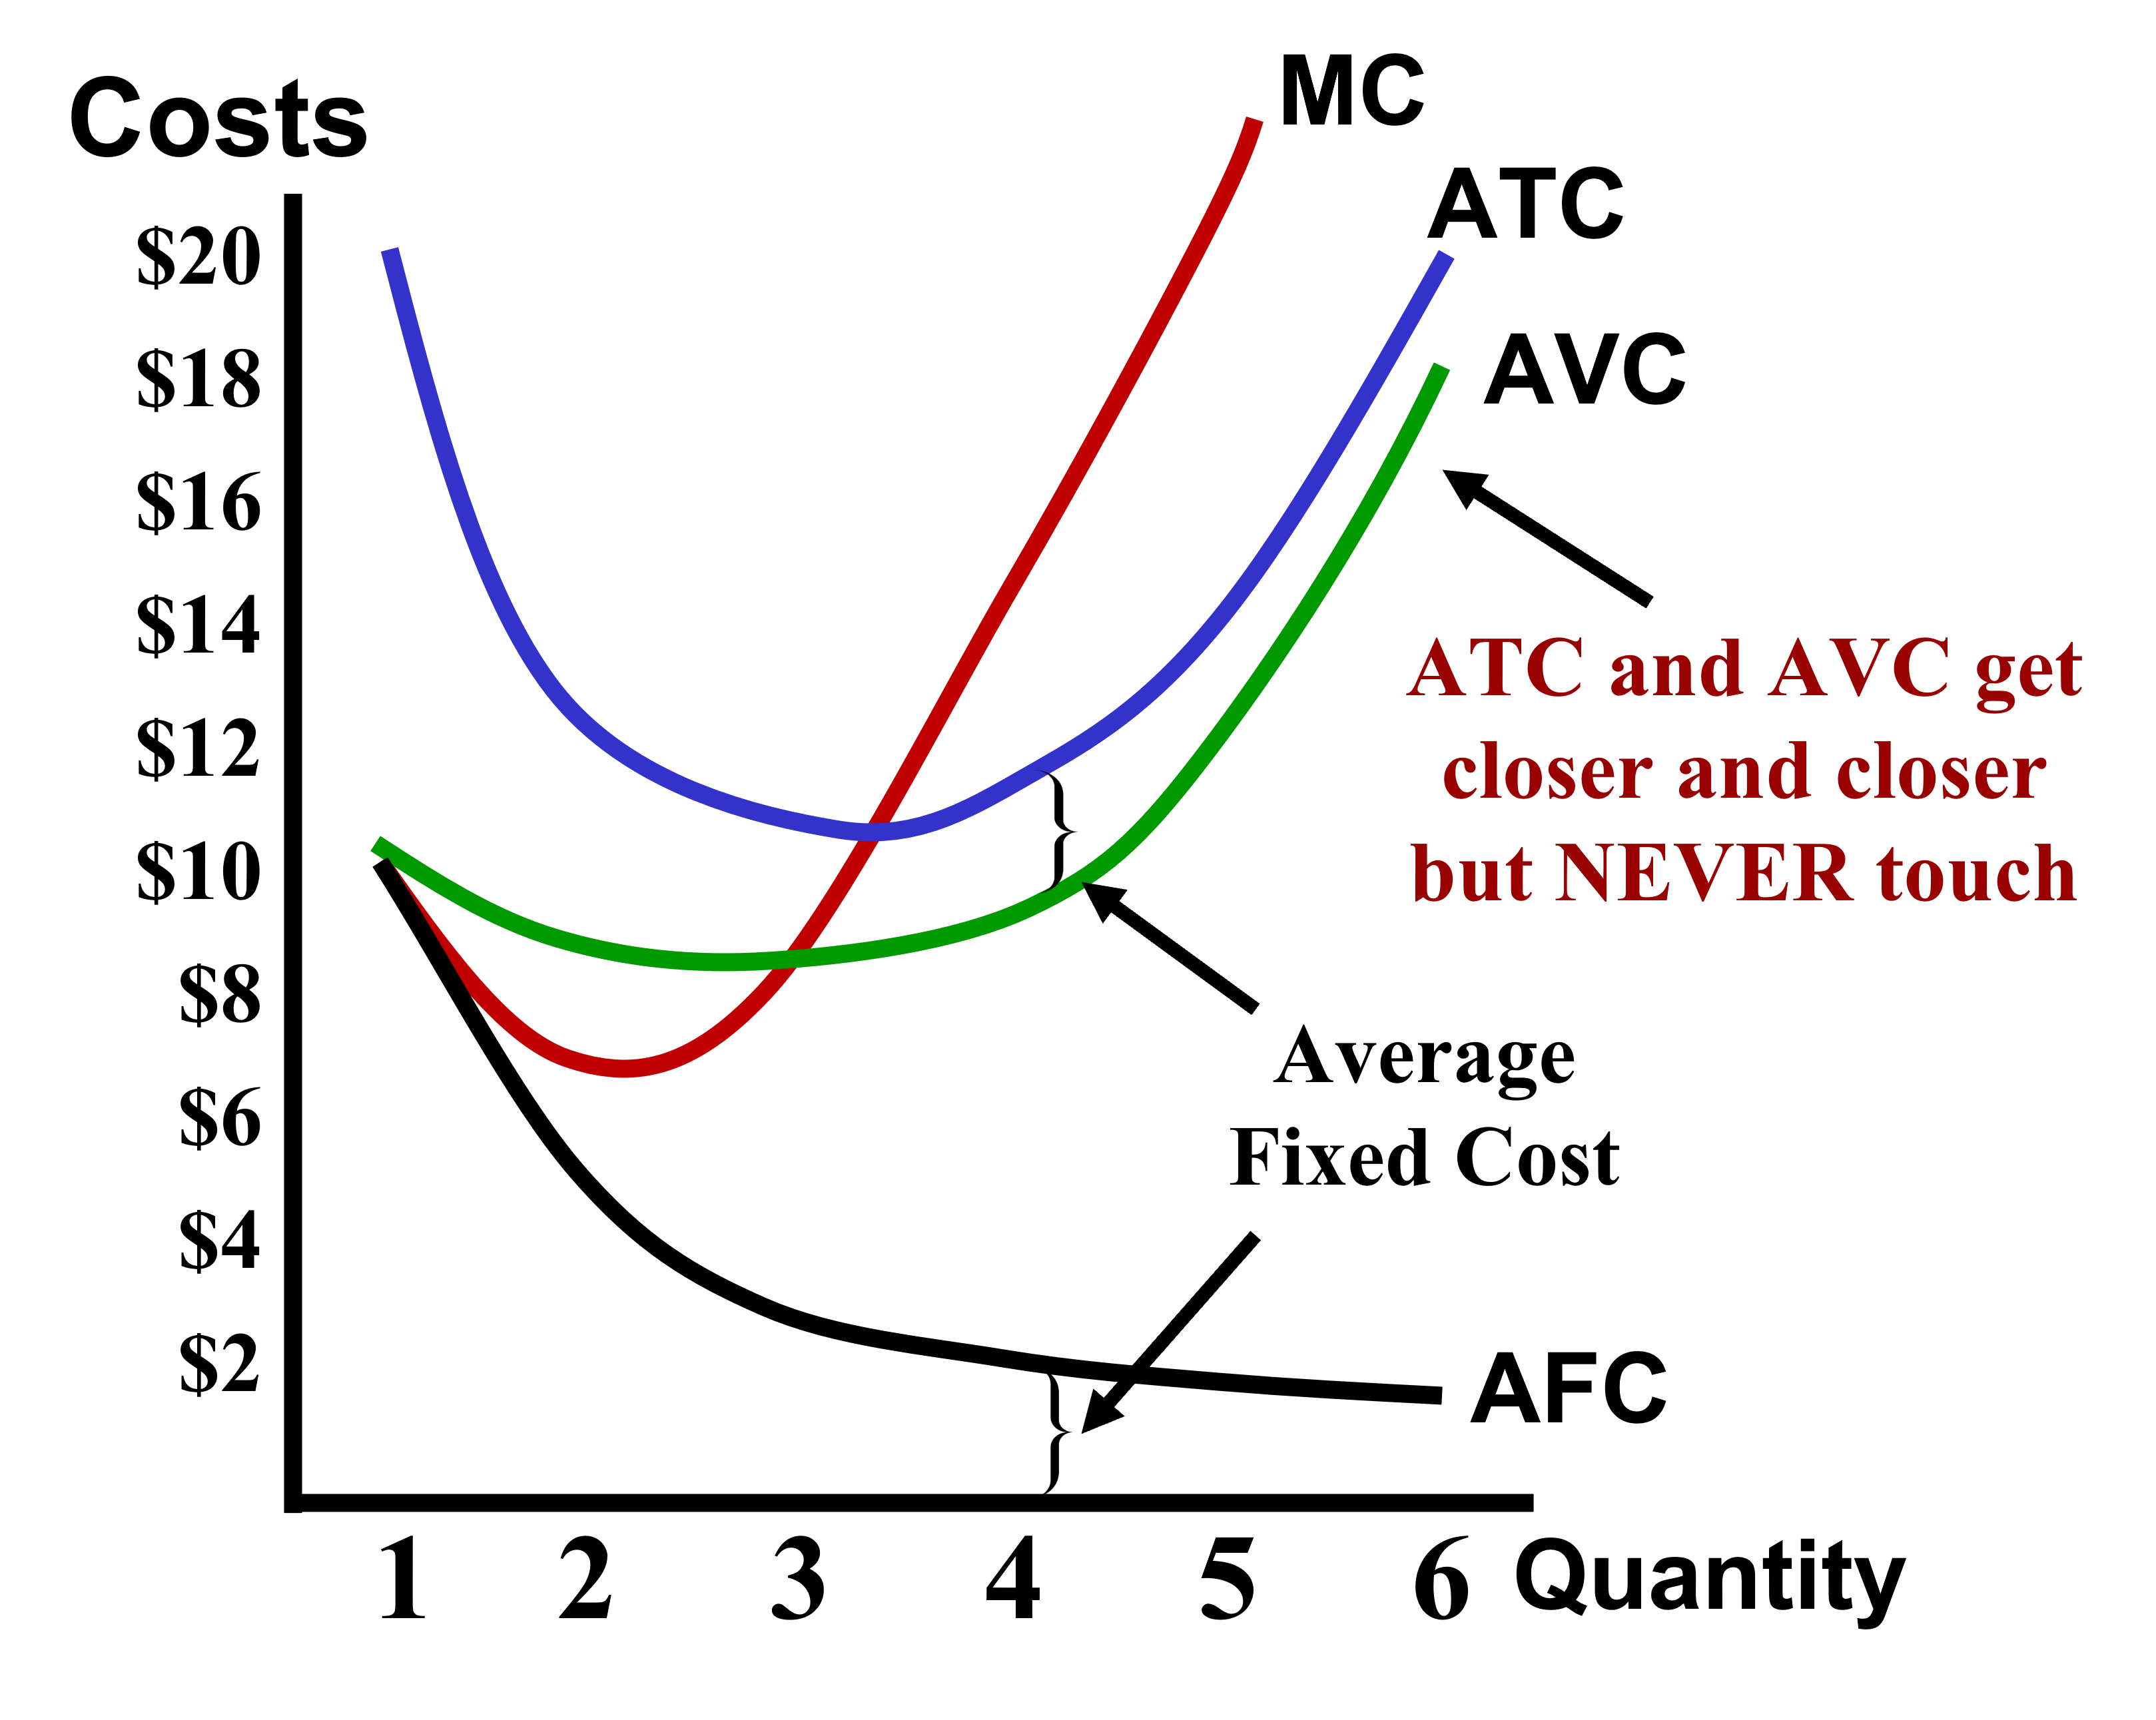
4. Reading and Applying the Cost Curve Graph
You can now calculate and graph the cost curves. The final step is to learn how to use these graphs to quickly find cost information and perform analysis.
The next video offers a concise summary of the graphical relationships and demonstrates a key practical skill: how to derive total cost figures directly from the per-unit cost graph. Given your technical background, you may find this geometric approach of identifying costs as areas on the graph particularly intuitive.
Short-Run Cost Curves (Part 2)- Micro Topic 3.2
This clip from Jacob Clifford provides a rapid-fire review of the cost curves and shows how to use them to analyze a firm's costs at a specific output level.
Watch from 00:41 to 02:40. The first part (to 01:36) is a great visual recap of the curve shapes and their relationships. The second part (from 01:36) shows how, for any given quantity, you can find the values of all the different costs. Focus on how he calculates the firm's Total Cost, Total Variable Cost, and Total Fixed Cost as rectangular areas on the graph. This is a very common technique in economic analysis.
This skill of translating between per-unit costs and total costs using the graph is extremely useful and brings together the concepts from this lesson and the previous one.
Conclusion
In this lesson, you have learned to calculate and graph the four essential per-unit cost curves that are central to the theory of the firm. We've seen how these curves are derived from total costs and how their shapes reflect the underlying realities of production.
Here are your key takeaways:
- Four Key Definitions: You can now calculate AFC, AVC, ATC (), and MC.
- Characteristic Shapes: You can graph the always-falling AFC curve and the U-shaped AVC, ATC, and MC curves.
- The Crucial Intersection: The MC curve always intersects the AVC and ATC curves at their minimum points. This is because if the cost of the next unit (MC) is below the average, it pulls the average down. If it's above the average, it pulls the average up.
- Graphical Analysis: You can read a cost-curve graph to find a firm's per-unit and total costs at a specific level of output.
In the previous module, you learned about the marginal product of labor. In this lesson, you learned about marginal cost. Have you noticed that the marginal product curve was "hill-shaped" while the marginal cost curve is "U-shaped"? This is no coincidence. In our next lesson, we will formally connect these two concepts and explain why the relationship between the marginal cost curve and the marginal product curve is a mirror image, completing the link between production and cost.